WeightWatchers 2002 Annual Report Download - page 80
Download and view the complete annual report
Please find page 80 of the 2002 WeightWatchers annual report below. You can navigate through the pages in the report by either clicking on the pages listed below, or by using the keyword search tool below to find specific information within the annual report.-
 1
1 -
2
-
3
-
4
-
5
-
6
-
7
-
8
-
9
-
10
-
11
-
12
-
13
-
14
-
15
-
16
-
17
-
18
-
19
-
20
-
21
-
22
-
23
-
24
-
25
-
26
-
27
-
28
-
29
-
30
-
31
-
32
-
33
-
34
-
35
-
36
-
37
-
38
-
39
-
40
-
41
-
42
-
43
-
44
-
45
-
46
-
47
-
48
-
49
-
50
-
51
-
52
-
53
-
54
-
55
-
56
-
57
-
58
-
59
-
60
-
61
-
62
-
63
-
64
-
65
-
66
-
67
-
68
-
69
-
 70
70 -
 71
71 -
 72
72 -
 73
73 -
 74
74 -
 75
75 -
 76
76 -
 77
77 -
 78
78 -
 79
79 -
 80
80 -
 81
81 -
 82
82 -
 83
83 -
 84
84 -
 85
85 -
 86
86 -
 87
87 -
 88
88 -
 89
89 -
 90
90 -
91
-
92
-
93
-
94
-
95
-
96
-
97
-
98
-
99
-
100
-
101
-
102
-
103
-
104
-
105
-
106
 |
 |

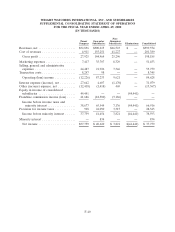
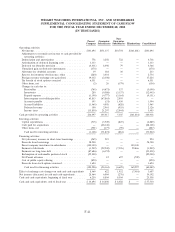
WEIGHT WATCHERS INTERNATIONAL, INC. AND SUBSIDIARIES
NOTES TO CONSOLIDATED FINANCIAL STATEMENTS (Continued)
(IN THOUSANDS, EXCEPT PER SHARE AMOUNTS)
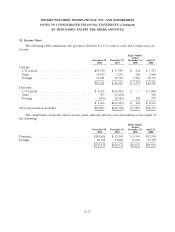
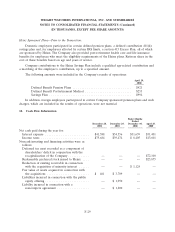
16. Segment and Geographic Data
The Company is engaged principally in one line of business, weight loss products and services. The
following table presents information about the Company by geographic area. There were no material
amounts of sales or transfers among geographic areas and no material amounts of United States export
sales.
External Sales
Eight Months
Ended
December 28, December 29, December 30, April 29,
2002 2001 2000 2000
United States..................... $542,885 $397,434 $150,199 $207,256
United Kingdom ................... 112,750 97,594 55,945 90,778
Continental Europe ................ 117,425 97,421 48,306 66,524
Australia and New Zealand ........... 36,584 31,421 18,725 35,016
$809,644 $623,870 $273,175 $399,574
Long-Lived Assets
December 28, December 29, December 30, April 29,
2002 2001 2000 2000
United States ..................... $299,349 $230,696 $142,641 $142,675
United Kingdom ................... 2,854 2,909 2,737 949
Continental Europe ................. 2,537 2,025 1,914 1,973
Australia and New Zealand ........... 18,302 16,260 18,402 21,132
$323,042 $251,890 $165,694 $166,729
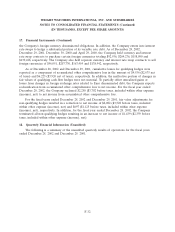
17. Financial Instruments
Fair Value of Financial Instruments:
The Company’s significant financial instruments include cash and cash equivalents, short and
long-term debt, current and noncurrent notes receivable, currency exchange agreements and guarantees.
In evaluating the fair value of significant financial instruments, the Company generally uses quoted
market prices of the same or similar instruments or calculates an estimated fair value on a discounted
cash flow basis using the rates available for instruments with the same remaining maturities. As of
December 28, 2002, the fair value of financial instruments held by the Company, excluding the 13%
Senior Subordinated Notes due 2009, approximated the recorded value. Based on current interest rates,
management believes that the carrying amount at December 28, 2002 of the Company’s 13% Senior
Subordinated Notes due 2009 of $254,000 has an estimated fair value of $286,000.
Derivative Instruments and Hedging:
The Company enters into forward and swap contracts to hedge transactions denominated in
foreign currencies to reduce currency risk associated with fluctuating exchange rates. These contracts
are used primarily to hedge certain inter-company cash flows and for payments arising from some of
F-31