WeightWatchers 2002 Annual Report Download - page 22
Download and view the complete annual report
Please find page 22 of the 2002 WeightWatchers annual report below. You can navigate through the pages in the report by either clicking on the pages listed below, or by using the keyword search tool below to find specific information within the annual report.-
 1
1 -
2
-
3
-
4
-
5
-
6
-
7
-
8
-
9
-
10
-
11
-
 12
12 -
 13
13 -
 14
14 -
 15
15 -
 16
16 -
 17
17 -
 18
18 -
 19
19 -
 20
20 -
 21
21 -
 22
22 -
 23
23 -
 24
24 -
 25
25 -
 26
26 -
 27
27 -
 28
28 -
 29
29 -
 30
30 -
 31
31 -
 32
32 -
33
-
34
-
35
-
36
-
37
-
38
-
39
-
40
-
41
-
42
-
43
-
44
-
45
-
46
-
47
-
48
-
49
-
50
-
51
-
52
-
53
-
54
-
55
-
56
-
57
-
58
-
59
-
60
-
61
-
62
-
63
-
64
-
65
-
66
-
67
-
68
-
69
-
70
-
71
-
72
-
73
-
74
-
75
-
76
-
77
-
78
-
79
-
80
-
81
-
82
-
83
-
84
-
85
-
86
-
87
-
88
-
89
-
90
-
91
-
92
-
93
-
94
-
95
-
96
-
97
-
98
-
99
-
100
-
101
-
102
-
103
-
104
-
105
-
106
 |
 |

Item 7. Management’s Discussion and Analysis of Financial Condition and Results of Operations
Overview
We are the leading provider of weight-loss services, operating in 30 countries around the world.
We conduct our business through a combination of company-owned and franchise operations, with
company-owned operations accounting for 67% of total worldwide attendance for the fiscal year ended
December 28, 2002 of which 67% of our revenues were derived from our U.S. operations, and the
remaining 33% of our revenues result from our international operations. We derive our revenues
principally from:
•Meeting fees. Our members pay us a weekly fee to attend our classes.
•Product sales. We sell proprietary products that complement our program, such as snack bars,
books, CD-ROMs and POINTS calculators, to our members and franchisees.
•Franchise royalties. Our franchisees typically pay us a royalty fee of 10% of their meeting fee
revenues.
•Other. We license our brand for certain foods, books and other products. We also generate
revenues from the publishing of books and magazines and third-party advertising.
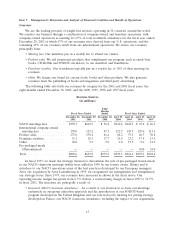
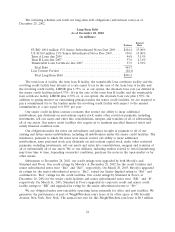
The following table sets forth our revenues by category for the 2002 and 2001 fiscal years, the
eight months ended December 30, 2000, and the 2000, 1999, 1998 and 1997 fiscal years.
Revenue Sources
(in millions)
Eight
Months
Fiscal Years Ended Ended Fiscal Years Ended
December 28, December 29, December 30, April 29, April 24, April 25, April 26,
2002 2001 2000 2000 1999 1998 1997
NACO meetings fees ......... $350.7 $262.5 $ 96.8 $130.8 $122.3 $ 93.8 $ 86.5
International company-owned
meeting fees.............. 170.0 153.2 87.3 152.7 143.9 129.0 113.6
Product sales ............... 237.6 170.4 66.4 84.2 57.3 46.7 30.8
Franchise royalties ........... 31.3 28.3 17.7 25.8 23.2 17.9 13.9
Other..................... 20.0 9.5 5.0 6.0 17.9 9.0 14.0
Pre-packaged meals
(Discontinued) ............ —————0.80 34.0
Total ..................... $809.6 $623.9 $273.2 $399.5 $364.6 $297.2 $292.8
In fiscal 1997, we made the strategic decision to discontinue the sale of pre-packaged frozen meals
in our NACO classroom meetings (which were added in 1990 by our former owner, Heinz) and to
introduce to our NACO operations some of the best practices developed by our European managers.
After our acquisition by Artal Luxembourg in 1999, we reorganized our management and strengthened
our strategic focus. Since 1997, our revenues have increased as shown in the chart above. Our
operating income margin has grown from 6.7% (before a restructuring charge) in fiscal 1997 to 36.7%
in fiscal 2002. The increases are principally a result of:
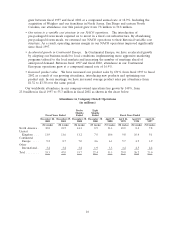
•Increased NACO classroom attendance. As a result of our decision to re-focus our meetings
exclusively on our group education approach and the introduction of our POINTS-based
program developed in the United Kingdom and our Liberty/Loyalty meeting fee pricing strategy
developed in France, our NACO classroom attendance, excluding the impact of our acquisitions,
15