WeightWatchers 2002 Annual Report Download - page 28
Download and view the complete annual report
Please find page 28 of the 2002 WeightWatchers annual report below. You can navigate through the pages in the report by either clicking on the pages listed below, or by using the keyword search tool below to find specific information within the annual report.Comparison of the fiscal year ended December 29, 2001 (52 weeks) to the twelve months ended
December 30, 2000 (54 weeks).
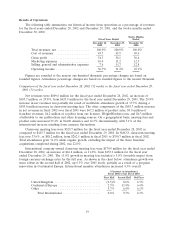
Net revenues were $623.9 million for the fiscal year ended December 29, 2001, an increase of
$184.5 million, or 42.0%, from $439.4 million for the twelve months ended December 30, 2000. Of the
$184.5 million increase, $112.2 million was attributable to NACO classroom meeting fees, $11.3 million
from international company-owned classroom meeting fees, $58.1 million from product sales and
$2.9 million from licensing, publications and other royalties. Pro forma for the acquisition of Weighco,
net revenues for the twelve months ended December 30, 2000 were $488.2 million. The pro forma
financial information assumes the acquisition of Weighco occurred at the beginning of the earliest
period presented.
NACO classroom meeting fees were $262.5 million for the fiscal year ended December 29, 2001,
an increase of $112.2 million, or 74.7%, from $150.3 million for the twelve months ended December 30,
2000. International company-owned classroom meeting fees were $153.2 million for the fiscal year
ended December 29, 2001, an increase of $11.3 million, or 8.0%, from $141.9 million for the twelve
months ended December 29, 2000. NACO meeting fees benefited from the inclusion of Weighco in the
current fiscal year. Additionally, the increases in NACO and international company-owned meeting fees
were the result of increased member attendance and the roll-out of new program innovations and price
increases in select markets, offset in part by negative exchange rate variances.
Product sales were $170.4 million for the fiscal year ended December 29, 2001, an increase of
$58.1 million, or 51.7%, from $112.3 million for the twelve months ended December 30, 2000. NACO
and international company-owned product sales were $99.7 million and $70.7 million, respectively. The
increases in product sales were primarily the result of increased member attendance and our strategy to
focus sales efforts on core classroom products, which has increased average product sales per
attendance.
Franchise royalties were $28.3 million for the fiscal year ended December 29, 2001, and for the
twelve months ended December 30, 2000. For the fiscal year ended December 29, 2001, domestic and
international franchise royalties were $23.3 million and $5.0 million, respectively. Pro forma for the
acquisition of Weighco, franchise royalties increased 24.4% for the fiscal year ended December 29,
2001. This increase was primarily the result of increased member attendance, offset in part by negative
exchange rate variances.
Royalties from licensing, publications and other were $9.5 million for the fiscal year ended
December 29, 2001, an increase of $2.9 million, or 43.9%, from $6.6 million for the twelve months
ended December 30, 2000. This increase was driven by an increase in advertising revenue from Weight
Watchers Magazine and an increase in licensing royalties.
Cost of revenues was $286.4 million for the fiscal year ended December 29, 2001, an increase of
$68.4 million, or 31.4%, from $218.0 million for the twelve months ended December 30, 2000. Gross
profit margin was 54.1% for the fiscal year ended December 29, 2001, compared to 50.4% for the
twelve months ended December 30, 2000. Typically, the gross profit margin for meeting fee revenue is
slightly higher than the gross profit margin for product sales. The increase in gross profit margin was
partly due to a $3.8 million non-recurring expense related to the elimination of a profit sharing
agreement with certain franchisees in the twelve months ended December 30, 2000. Excluding this
charge, the gross profit margin in the twelve months ended December 30, 2000 was 51.3%. The
remaining increase in gross profit margin reflects increased attendance, price increases and cost control
initiatives.
Marketing expenses were $69.7 million for the fiscal year ended December 29, 2001, an increase of
$14.9 million, or 27.2%, from $54.8 million for the twelve months ended December 30, 2000. The
increase in marketing expenses was primarily the result of additional advertising to promote the new
21


