WeightWatchers 2002 Annual Report Download - page 23
Download and view the complete annual report
Please find page 23 of the 2002 WeightWatchers annual report below. You can navigate through the pages in the report by either clicking on the pages listed below, or by using the keyword search tool below to find specific information within the annual report.-
 1
1 -
2
-
3
-
4
-
5
-
6
-
7
-
8
-
9
-
10
-
11
-
12
-
 13
13 -
 14
14 -
 15
15 -
 16
16 -
 17
17 -
 18
18 -
 19
19 -
 20
20 -
 21
21 -
 22
22 -
 23
23 -
 24
24 -
 25
25 -
 26
26 -
 27
27 -
 28
28 -
 29
29 -
 30
30 -
 31
31 -
 32
32 -
 33
33 -
34
-
35
-
36
-
37
-
38
-
39
-
40
-
41
-
42
-
43
-
44
-
45
-
46
-
47
-
48
-
49
-
50
-
51
-
52
-
53
-
54
-
55
-
56
-
57
-
58
-
59
-
60
-
61
-
62
-
63
-
64
-
65
-
66
-
67
-
68
-
69
-
70
-
71
-
72
-
73
-
74
-
75
-
76
-
77
-
78
-
79
-
80
-
81
-
82
-
83
-
84
-
85
-
86
-
87
-
88
-
89
-
90
-
91
-
92
-
93
-
94
-
95
-
96
-
97
-
98
-
99
-
100
-
101
-
102
-
103
-
104
-
105
-
106
 |
 |

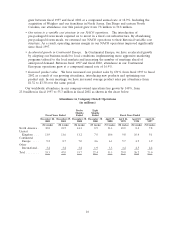
grew between fiscal 1997 and fiscal 2002 at a compound annual rate of 18.9%. Including the
acquisition of Weighco and our franchises in North Jersey, San Diego and eastern North
Carolina, our attendance over this period grew from 7.8 million to 30.8 million.
•Our return to a variable cost structure in our NACO operations. The introduction of
pre-packaged frozen meals required us to invest in a fixed cost infrastructure. By abandoning
pre-packaged frozen meals, we returned our NACO operations to their historical variable cost
structure. As a result, operating income margin in our NACO operations improved significantly
since fiscal 1997.
•Accelerated growth in Continental Europe. In Continental Europe, we have accelerated growth
by adapting our business model to local conditions, implementing more aggressive marketing
programs tailored to the local markets and increasing the number of meetings ahead of
anticipated demand. Between fiscal 1997 and fiscal 2002, attendance in our Continental
European operations grew at a compound annual rate of 16.4%.
•Increased product sales. We have increased our product sales by 671% from fiscal 1997 to fiscal
2002 as a result of our growing attendance, introducing new products and optimizing our
product mix. In our meetings, we have increased average product sales per attendance from
$1.32 to $3.30 over the same period.
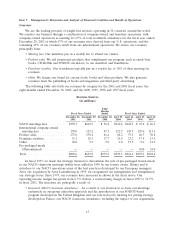
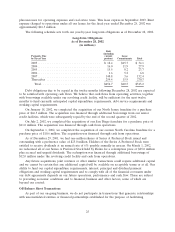
Our worldwide attendance in our company-owned operations has grown by 140%, from
23.0 million in fiscal 1997 to 55.3 million in fiscal 2002 as shown in the chart below.
Attendance in Company-Owned Operations
(in millions)
Twelve Eight
Months Months
Fiscal Years Ended Ended Ended Fiscal Years Ended
December 28, December 29, December 30, December 30, April 29, April 24, April 25, April 26,
2002 2001 2000 2000 2000 1999 1998 1997
(52 weeks) (52 weeks) (54 weeks) (35 weeks) (53 weeks) (52 weeks) (52 weeks) (52 weeks)
North America . 30.8 23.5 14.3 8.9 13.3 10.9 8.4 7.8
United
Kingdom . . . 11.9 11.6 11.2 7.0 10.6 9.8 10.4 9.1
Continental
Europe . . . . 9.2 8.7 7.0 4.6 6.1 5.7 4.9 3.9
Other
International . 3.4 3.2 3.2 1.9 3.3 3.4 2.5 2.2
Total ........ 55.3 47.0 35.7 22.4 33.3 29.8 26.2 23.0
16