WeightWatchers 2002 Annual Report Download - page 26
Download and view the complete annual report
Please find page 26 of the 2002 WeightWatchers annual report below. You can navigate through the pages in the report by either clicking on the pages listed below, or by using the keyword search tool below to find specific information within the annual report.-
 1
1 -
2
-
3
-
4
-
5
-
6
-
7
-
8
-
9
-
10
-
11
-
12
-
13
-
14
-
15
-
 16
16 -
 17
17 -
 18
18 -
 19
19 -
 20
20 -
 21
21 -
 22
22 -
 23
23 -
 24
24 -
 25
25 -
 26
26 -
 27
27 -
 28
28 -
 29
29 -
 30
30 -
 31
31 -
 32
32 -
 33
33 -
 34
34 -
 35
35 -
 36
36 -
37
-
38
-
39
-
40
-
41
-
42
-
43
-
44
-
45
-
46
-
47
-
48
-
49
-
50
-
51
-
52
-
53
-
54
-
55
-
56
-
57
-
58
-
59
-
60
-
61
-
62
-
63
-
64
-
65
-
66
-
67
-
68
-
69
-
70
-
71
-
72
-
73
-
74
-
75
-
76
-
77
-
78
-
79
-
80
-
81
-
82
-
83
-
84
-
85
-
86
-
87
-
88
-
89
-
90
-
91
-
92
-
93
-
94
-
95
-
96
-
97
-
98
-
99
-
100
-
101
-
102
-
103
-
104
-
105
-
106
 |
 |

Results of Operations
The following table summarizes our historical income from operations as a percentage of revenues
for the fiscal years ended December 28, 2002 and December 29, 2001, and the twelve months ended
December 30, 2000.
Twelve Months
Fiscal Years Ended Ended
December 28, December 29, December 30,
2002 2001 2000
Total revenues, net .................. 100.0% 100.0% 100.0%
Cost of revenues .................... 45.7 45.9 49.6
Gross profit ....................... 54.3 54.1 50.4
Marketing expenses .................. 10.0 11.2 12.5
Selling, general and administrative expenses 7.6 11.7 12.8
Operating income ................... 36.7% 31.2% 25.1%
Figures are rounded to the nearest one hundred thousand; percentage changes are based on
rounded figures. Attendance percentage changes are based on rounded figures to the nearest thousand.
Comparison of the fiscal year ended December 28, 2002 (52 weeks) to the fiscal year ended December 29,
2001 (52 weeks).
Net revenues were $809.6 million for the fiscal year ended December 28, 2002, an increase of
$185.7 million, or 29.8%, from $623.9 million for the fiscal year ended December 29, 2001. The 29.8%
increase in net revenues was partially the result of worldwide attendance growth of 17.7% driving a
$105.0 million increase in classroom meeting fees. The other components of the $185.7 million increase
in net revenues in fiscal 2002 over fiscal 2001 were $67.2 million of product sales, $3.0 million of
franchise revenues, $4.2 million of royalties from our licensee, WeightWatchers.com, and $6.3 million
attributable to our publications and other licensing sources. On a geographical basis, meeting fees and
product sales increased 37.4% in North America and 16.5% internationally, with 5.1% of the
international increase resulting from currency fluctuations.
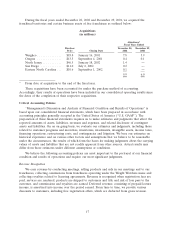
Classroom meeting fees were $520.7 million for the fiscal year ended December 28, 2002 as
compared to $415.7 million for the fiscal year ended December 29, 2001. In NACO, classroom meeting
fees rose 33.6%, or $88.2 million, from $262.5 million in fiscal 2001 to $350.7 million in fiscal 2002.
Total attendances grew 31.2% while organic growth, excluding the impact of the three franchise
acquisitions completed during 2002, was 22.0%.
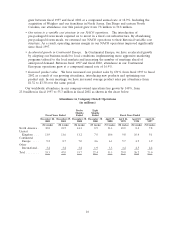
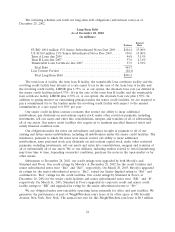
International company-owned classroom meeting fees were $170.0 million for the fiscal year ended
December 28, 2002, an increase of $16.8 million, or 11.0%, from $153.2 million for the fiscal year
ended December 29, 2001. The 11.0% growth in meeting fees included a 5.0% favorable impact from
foreign currency exchange rates for the full year. As shown in the chart below, attendance growth was
more robust in the second half of 2002, up 9.3% over 2001 levels, partially as a result of a program
innovation in Continental Europe. International member attendances increased 4.3% overall.
% Increase in Attendances
Fiscal 2002 versus Fiscal 2001
First Half Second Half Full Year
United Kingdom .......................... (2.3)% 8.6% 2.3%
Continental Europe ........................ 2.3% 11.4% 6.4%
Other.................................. 5.7% 6.4% 6.1%
Total International ..................... 0.4% 9.3% 4.3%
19