Walmart 2003 Annual Report Download - page 51
Download and view the complete annual report
Please find page 51 of the 2003 Walmart annual report below. You can navigate through the pages in the report by either clicking on the pages listed below, or by using the keyword search tool below to find specific information within the annual report.-
 1
1 -
2
-
3
-
4
-
5
-
6
-
7
-
8
-
9
-
10
-
11
-
12
-
13
-
14
-
15
-
16
-
17
-
18
-
19
-
20
-
21
-
22
-
23
-
24
-
25
-
26
-
27
-
28
-
29
-
30
-
31
-
32
-
33
-
34
-
35
-
36
-
37
-
38
-
39
-
40
-
 41
41 -
 42
42 -
 43
43 -
 44
44 -
 45
45 -
 46
46 -
 47
47 -
 48
48 -
 49
49 -
 50
50 -
 51
51 -
 52
52 -
 53
53 -
 54
54 -
 55
55 -
 56
56
 |
 |

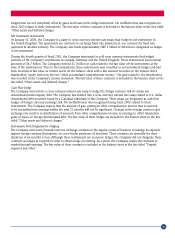
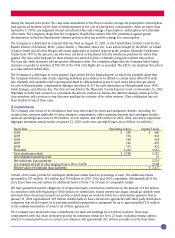
Fiscal year ended January 31, 2003 Wal-Mart Stores SAM’S CLUB International Other Consolidated
Revenues from external customers $ 157,121 $ 31,702 $ 40,794 $ 14,907 $ 244,524
Intercompany real estate charge (income) 2,228 453 – (2,681) –
Depreciation and amortization 1,287 216 639 1,290 3,432
Operating income (loss) 11,873 1,028 2,033 (1,290) 13,644
Interest expense, net (925)
Income before income taxes and
minority interest 12,719
Total assets $ 24,748 $ 4,404 $ 30,709 $ 34,824 $ 94,685
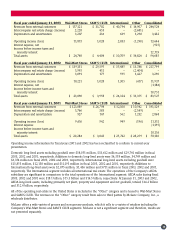
Fiscal year ended January 31, 2002 Wal-Mart Stores SAM’S CLUB International Other Consolidated
Revenues from external customers $ 139,131 $ 29,395 $ 35,485 $ 13,788 $ 217,799
Intercompany real estate charge (income) 1,993 411 – (2,404) –
Depreciation and amortization 1,091 177 595 1,427 3,290
Operating income (loss) 10,221 1,028 1,305 (617) 11,937
Interest expense, net (1,186)
Income before income taxes and
minority interest 10,751
Total assets $ 21,890 $ 3,958 $ 26,324 $ 31,355 $ 83,527
Fiscal year ended January 31, 2001 Wal-Mart Stores SAM’S CLUB International Other Consolidated
Revenues from external customers $ 121,889 $ 26,798 $ 32,100 $ 10,542 $ 191,329
Intercompany real estate charge (income) 1,766 383 – (2,149) –
Depreciation and amortization 927 147 562 1,232 2,868
Operating income (loss) 9,616 942 949 (196) 11,311
Interest expense (1,195)
Income before income taxes and
minority interest 10,116
Total assets $ 20,286 $ 3,843 $ 25,742 $ 28,259 $ 78,130
Operating income information for fiscal years 2001 and 2002 has been reclassified to conform to current-year
presentation.
Domestic long-lived assets excluding goodwill were $38,051 million, $33,612 million and $29,741 million in fiscal
2003, 2002 and 2001, respectively. Additions to domestic long-lived assets were $6,358 million, $4,749 million and
$6,374 million in fiscal 2003, 2002 and 2001, respectively. International long-lived assets excluding goodwill were
$13,853 million, $12,138 million and $11,193 million in fiscal 2003, 2002 and 2001, respectively. Additions to
International long-lived assets were $2,075 million, $1,436 million and $711 million in fiscal 2003, 2002 and 2001,
respectively. The International segment includes all international real estate. The operations of the Company’s ASDA
subsidiary are significant in comparison to the total operations of the International segment. ASDA sales during fiscal
2003, 2002 and 2001 were $18.1 billion, $15.3 billion and $14.5 billion, respectively. At January 31, 2003 and 2002,
ASDA long-lived assets, including primarily net plant, property and equipment and net goodwill, totaled $14.2 billion
and $12.4 billion, respectively.
All of the operating real estate in the United States is included in the “Other” category and is leased to Wal-Mart Stores
and SAM’S CLUB. The revenues in the “Other” category result from sales to third parties by McLane Company, Inc., a
wholesale distributor.
McLane offers a wide variety of grocery and non-grocery products, which it sells to a variety of retailers including the
Company’s Wal-Mart Stores and SAM’S CLUB segments. McLane is not a significant segment and therefore, results are
not presented separately.
49