Walmart 2003 Annual Report Download - page 32
Download and view the complete annual report
Please find page 32 of the 2003 Walmart annual report below. You can navigate through the pages in the report by either clicking on the pages listed below, or by using the keyword search tool below to find specific information within the annual report.-
 1
1 -
2
-
3
-
4
-
5
-
6
-
7
-
8
-
9
-
10
-
11
-
12
-
13
-
14
-
15
-
16
-
17
-
18
-
19
-
20
-
21
-
 22
22 -
 23
23 -
 24
24 -
 25
25 -
 26
26 -
 27
27 -
 28
28 -
 29
29 -
 30
30 -
 31
31 -
 32
32 -
 33
33 -
 34
34 -
 35
35 -
 36
36 -
 37
37 -
 38
38 -
 39
39 -
 40
40 -
 41
41 -
 42
42 -
43
-
44
-
45
-
46
-
47
-
48
-
49
-
50
-
51
-
52
-
53
-
54
-
55
-
56
 |
 |

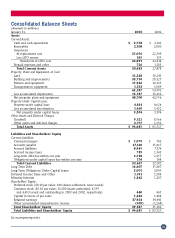
Consolidated Statements of Income
(Amounts in millions except per share data)
Fiscal years ended January 31, 2003 2002 2001
Revenues:
Net sales $ 244,524 $ 217,799 $ 191,329
Other income 2,001 1,873 1,787
246,525 219,672 193,116
Costs and Expenses:
Cost of sales 191,838 171,562 150,255
Operating, selling and general and administrative expenses 41,043 36,173 31,550
Operating Profit 13,644 11,937 11,311
Interest:
Debt 803 1,083 1,104
Capital leases 260 274 279
Interest income (138) (171) (188)
925 1,186 1,195
Income Before Income Taxes and Minority Interest 12,719 10,751 10,116
Provision for Income Taxes
Current 3,967 3,712 3,350
Deferred 520 185 342
4,487 3,897 3,692
Income Before Minority Interest 8,232 6,854 6,424
Minority Interests (193) (183) (129)
Net Income $ 8,039 $ 6,671 $ 6,295
Net Income Per Common Share:
Basic Net Income Per Common Share:
Net Income Per Common Share $ 1.81 $1.49 $1.41
Average Number of Common Shares 4,430 4,465 4,465
Diluted Net Income Per Common Share:
Net Income Per Common Share $ 1.81 $ 1.49 $ 1.40
Average Number of Common Shares 4,446 4,481 4,484
See accompanying notes.
30