Walmart 2003 Annual Report Download - page 20
Download and view the complete annual report
Please find page 20 of the 2003 Walmart annual report below. You can navigate through the pages in the report by either clicking on the pages listed below, or by using the keyword search tool below to find specific information within the annual report.-
 1
1 -
2
-
3
-
4
-
5
-
6
-
7
-
8
-
9
-
 10
10 -
 11
11 -
 12
12 -
 13
13 -
 14
14 -
 15
15 -
 16
16 -
 17
17 -
 18
18 -
 19
19 -
 20
20 -
 21
21 -
 22
22 -
 23
23 -
 24
24 -
 25
25 -
 26
26 -
 27
27 -
 28
28 -
 29
29 -
 30
30 -
31
-
32
-
33
-
34
-
35
-
36
-
37
-
38
-
39
-
40
-
41
-
42
-
43
-
44
-
45
-
46
-
47
-
48
-
49
-
50
-
51
-
52
-
53
-
54
-
55
-
56
 |
 |

Management’s Discussion and Analysis
Wal-Mart is in the business of serving customers. In the United States, our operations are centered on operating retail
stores and membership warehouse clubs. Internationally, our operations are centered on retail stores, warehouse clubs and
restaurants. We have built our business by offering our customers quality merchandise at low prices. We are able to lower
the cost of merchandise through our negotiations with suppliers and by efficiently managing our distribution network. The
key to our success is our ability to grow our base business. In the U.S. we grow our base business by building new stores and
by increasing sales in our existing stores. Internationally, we grow our business by building new stores, increasing sales in
our existing stores and through acquisitions. We intend to continue to expand both domestically and internationally.
We intend for this discussion to provide you with information that will assist you in understanding our financial
statements, the changes in certain key items in those financial statements from year to year, and the primary factors that
accounted for those changes, as well as how certain accounting principles affect our financial statements. The discussion
also provides information about the financial results of the various segments of our business so that you may better
understand how those segments and their results affect the financial condition and results of operations of the Company
as a whole. This discussion should be read in conjunction with our financial statements as of January 31, 2003 and the
year then ended and the notes accompanying those financial statements.
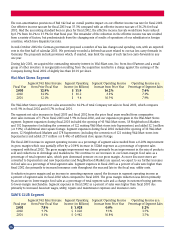
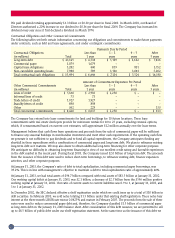
Net Sales
The Company and each of its operating segments had net sales (in millions) for the three fiscal years ended January 31,
2003 as follows:
Total Company Increase
Fiscal Year Wal-Mart Stores SAM’S CLUB International Other Total Company from Prior Fiscal Year
2003 $ 157,121 $ 31,702 $ 40,794 $ 14,907 $ 244,524 12%
2002 139,131 29,395 35,485 13,788 217,799 14%
2001 121,889 26,798 32,100 10,542 191,329 16%
Our net sales grew by 12% in fiscal 2003 when compared with fiscal 2002. That increase resulted from our domestic and
international expansion programs, and a domestic comparative store sales increase of 5% when compared with fiscal 2002.
The net sales increase of 14% in fiscal 2002, when compared with fiscal 2001, resulted from our domestic and
international expansion programs, and a domestic comparative store sales increase of 6%. We consider comparative stores
sales to be sales at stores that were open as of February 1st of the prior fiscal year and have not been expanded or relocated
since February 1st of the prior fiscal year. Stores that were expanded or relocated during that period are not included in the
calculation of comparative store sales. Comparative store sales are also referred to as “same-store” sales within the retail
industry. The Wal-Mart Stores and SAM’S CLUB segments include domestic units only. Wal-Mart Stores and SAM’S CLUBS
located outside the United States are included in the International segment.
Costs and Expenses
For fiscal 2003, our cost of sales decreased as a percentage of total net sales when compared to fiscal 2002, resulting in an
overall increase of 0.32% in the Company’s gross profit as a percentage of sales (our “gross margin”) from 21.23% in fiscal
2002 to a gross margin of 21.55% in fiscal 2003. This increase in gross margin occurred primarily due to lower shrinkage,
reduced markdowns and improvements in the mix of product sold. Partially offsetting the overall increase in gross margin
in fiscal 2003, the Company’s cost of sales increased by $30 million as a result of a LIFO inventory adjustment. The
balance in the LIFO reserve on the Company’s balance sheet is attributable to food inventories as well as other inventories
held by our subsidiary, McLane Company, Inc. We believe that these categories will remain inflationary in the near future
and that future gross margins will continue to experience downward pressure from LIFO adjustments, such as that which
occurred in fiscal 2003. Management also expects downward pressure on our gross margins as food sales continue to
increase as a percentage of total Company sales both domestically and internationally. This trend results from the
Company’s program to convert many of our Wal-Mart discount stores to Supercenters, which have full-line food
departments, the opening of additional Supercenters and the opening of additional Neighborhood Markets all of which
result in increases in food sales as a percentage of our total net sales. Food products generally carry lower margins than
general merchandise.
18