Walmart 2003 Annual Report Download - page 18
Download and view the complete annual report
Please find page 18 of the 2003 Walmart annual report below. You can navigate through the pages in the report by either clicking on the pages listed below, or by using the keyword search tool below to find specific information within the annual report.-
 1
1 -
2
-
3
-
4
-
5
-
6
-
7
-
 8
8 -
 9
9 -
 10
10 -
 11
11 -
 12
12 -
 13
13 -
 14
14 -
 15
15 -
 16
16 -
 17
17 -
 18
18 -
 19
19 -
 20
20 -
 21
21 -
 22
22 -
 23
23 -
 24
24 -
 25
25 -
 26
26 -
 27
27 -
 28
28 -
29
-
30
-
31
-
32
-
33
-
34
-
35
-
36
-
37
-
38
-
39
-
40
-
41
-
42
-
43
-
44
-
45
-
46
-
47
-
48
-
49
-
50
-
51
-
52
-
53
-
54
-
55
-
56
 |
 |

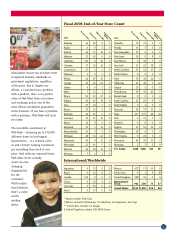
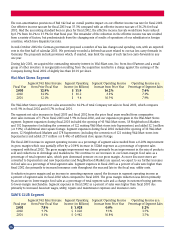
11-Year Financial Summary
(Dollar amounts in millions except per share data) 2003 2002 2001
Net sales $ 244,524 $ 217,799 $ 191,329
Net sales increase 12% 14% 16%
Domestic comparative store sales increase* 5% 6% 5%
Other income-net 2,001 1,873 1,787
Cost of sales 191,838 171,562 150,255
Operating, selling and general and administrative expenses 41,043 36,173 31,550
Interest costs:
Debt 803 1,083 1,104
Capital leases 260 274 279
Interest income (138) (171) (188)
Provision for income taxes 4,487 3,897 3,692
Minority interest and equity in unconsolidated subsidiaries (193) (183) (129)
Cumulative effect of accounting change, net of tax –––
Net income 8,039 6,671 6,295
Per share of common stock:
Basic net income 1.81 1.49 1.41
Diluted net income 1.81 1.49 1.40
Dividends 0.30 0.28 0.24
Financial Position
Current assets $ 30,483 $ 27,878 $ 26,555
Inventories at replacement cost 25,056 22,749 21,644
Less LIFO reserve 165 135 202
Inventories at LIFO cost 24,891 22,614 21,442
Net property, plant and equipment and capital leases 51,904 45,750 40,934
Total assets 94,685 83,527 78,130
Current liabilities 32,617 27,282 28,949
Long-term debt 16,607 15,687 12,501
Long-term obligations under capital leases 3,001 3,045 3,154
Shareholders’ equity 39,337 35,102 31,343
Financial Ratios
Current ratio 0.9 1.0 0.9
Inventories/working capital (11.7) 38.2 (9.0)
Return on assets** 9.2% 8.5% 8.7%
Return on shareholders’ equity*** 21.6% 20.1% 22.0%
Other Year-End Data
Number of domestic Wal-Mart stores 1,568 1,647 1,736
Number of domestic Supercenters 1,258 1,066 888
Number of domestic SAM’S CLUBS 525 500 475
Number of domestic Neighborhood Markets 49 31 19
International units 1,288 1,170 1,070
Number of Shareholders of record 330,000 324,000 317,000
*Comparative store sales are considered to be sales at stores that were open as of February 1 of the prior fiscal year and
have not been expanded or relocated since February 1 of the prior fiscal year.
** Net income before minority interest, equity in unconsolidated subsidiaries and cumulative effect of accounting
change/average assets
*** Net income/average shareholders’ equity
**** Calculated giving effect to the amount by which a lawsuit settlement exceeded established reserves. If this settlement was
not considered, the return was 9.8%.
16