Walmart 2003 Annual Report Download - page 23
Download and view the complete annual report
Please find page 23 of the 2003 Walmart annual report below. You can navigate through the pages in the report by either clicking on the pages listed below, or by using the keyword search tool below to find specific information within the annual report.-
 1
1 -
2
-
3
-
4
-
5
-
6
-
7
-
8
-
9
-
10
-
11
-
12
-
 13
13 -
 14
14 -
 15
15 -
 16
16 -
 17
17 -
 18
18 -
 19
19 -
 20
20 -
 21
21 -
 22
22 -
 23
23 -
 24
24 -
 25
25 -
 26
26 -
 27
27 -
 28
28 -
 29
29 -
 30
30 -
 31
31 -
 32
32 -
 33
33 -
34
-
35
-
36
-
37
-
38
-
39
-
40
-
41
-
42
-
43
-
44
-
45
-
46
-
47
-
48
-
49
-
50
-
51
-
52
-
53
-
54
-
55
-
56
 |
 |

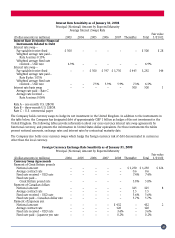
The SAM’S CLUB segment net sales amounted to 13.0% of total Company net sales in fiscal 2003, which compares to
13.5% and 14.0% in fiscal 2002 and 2001, respectively. The decrease in this segment’s sales as a percent of total Company
sales in fiscal 2003 and 2002 when compared to fiscal 2001 resulted from the International segment net sales and the
Wal-Mart Stores segment net sales growing at a faster rate than the SAM’S CLUB segment net sales.
Growth in net sales for the SAM’S CLUB segment in fiscal 2003 and fiscal 2002 resulted from comparative club sales
increases of 2.3% in fiscal 2003 and 5.7% in fiscal 2002, and our expansion program. Segment expansion during each of
fiscal 2003 and 2002 consisted of the opening of 25 new clubs and added 4.0 million (or 6.5%) and 3.8 million (or 6.4%)
of additional club square footage in fiscal 2003 and fiscal 2002, respectively.
Operating income as a percentage of sales decreased in fiscal 2003 when compared to fiscal 2002. Segment gross margin
and other income as a percent of sales were unchanged when comparing fiscal 2003 with fiscal 2002. Segment operating
expenses as a percent of sales increased by 0.26% in fiscal 2003. Expense pressures were felt by the SAM’S CLUB segment
in the areas of insurance, property taxes and food distribution costs.
Segment gross margin increased slightly during fiscal 2002 when compared with fiscal 2001; however, an increase in
operating expense as a percent of sales offset this margin increase, leaving segment operating income as a percent of sales
unchanged from fiscal 2001. The main expense pressures in fiscal 2002 in the SAM’S CLUB segment occurred in the areas
of utility and maintenance and repair costs.
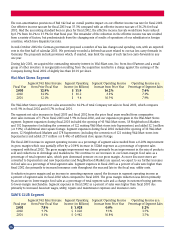
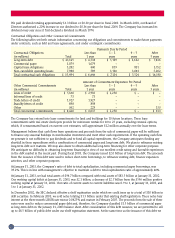
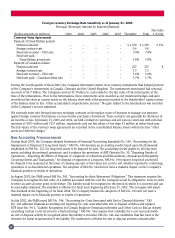
International Segment
Segment Net Sales Increase Segment Operating Segment Operating Income Operating Income as a
Fiscal year from Prior Fiscal Year Income (in Billions) Increase from Prior Year Percentage of Segment Sales
2003 15.0% $ 2.033 55.8% 5.0%
2002 10.5% $ 1.305 37.5% 3.7%
2001 41.2% $ 0.949 41.6% 3.0%
Our International segment is comprised of wholly-owned operations in Argentina, Canada, Germany, South Korea, Puerto
Rico and the United Kingdom; operations through joint ventures in China, operations through majority-owned subsidiaries
in Brazil and Mexico and through a minority investment in Japan. International sales accounted for approximately 16.7%
of total Company sales in fiscal 2003 compared with 16.3% in fiscal 2002 and 16.8% in fiscal 2001.
The fiscal 2003 increase in International net sales and operating income primarily resulted from both improved operating
results and our international expansion program. In fiscal 2003, excluding the units acquired in the Amigo acquisition,
the International segment opened, expanded or relocated 115 units which added 8.1 million (or 8.3%) of additional unit
square footage. Additionally, the impact of changes in foreign currency exchange rates positively affected the translation
of International segment sales into U.S. dollars by an aggregate of $47 million in fiscal 2003.
The fiscal 2002 increase in International sales and operating income primarily resulted from both improved operating
results and our international expansion program. In fiscal 2002, the International segment opened, expanded or relocated
128 units which added 8.4 million (or 9.5%) of additional unit square footage. Partially offsetting the impact of the
expansion program, changes in foreign currency exchange rates negatively affected the translation of International segment
sales into U.S. dollars by an aggregate of $1.1 billion in fiscal 2002.
Fiscal 2003 sales at our United Kingdom subsidiary ASDA, made up 44.5% of the International segment net sales. Sales
included in the Company’s consolidated income statement for ASDA during fiscal 2003, 2002 and 2001 were $18.1 billion,
$15.3 billion and $14.5 billion, respectively.
The fiscal 2003 increase in segment operating income as a percentage of segment sales resulted from a 0.41% improvement
in gross margin and a 0.77% reduction in operating expenses as a percentage of segment sales compared with fiscal 2002.
The adoption of FAS 142 affected the comparison of operating income between fiscal 2003 and fiscal 2002 because, in
accordance with FAS 142, we did not record any goodwill amortization expenses during fiscal 2003. If the International
segments expenses for the fiscal 2002 were adjusted to remove the goodwill amortization expense recorded for that period
(but which would not have been recorded if FAS 142 had been in place in the prior year), the reduction of operating
expenses stated as a percentage of segment sales for fiscal 2003 compared with fiscal 2002 would have changed from the
0.77% reduction discussed above to a 0.16% reduction and the International segment’s operating income in fiscal 2002
would have increased $216 million to $1,521 million for fiscal 2002. If FAS 142 had been effective in fiscal 2002, the
segment’s operating income increase from the prior fiscal year would have been reduced from 55.8% to 33.7%.
21