Walmart 2003 Annual Report Download - page 22
Download and view the complete annual report
Please find page 22 of the 2003 Walmart annual report below. You can navigate through the pages in the report by either clicking on the pages listed below, or by using the keyword search tool below to find specific information within the annual report.-
 1
1 -
2
-
3
-
4
-
5
-
6
-
7
-
8
-
9
-
10
-
11
-
 12
12 -
 13
13 -
 14
14 -
 15
15 -
 16
16 -
 17
17 -
 18
18 -
 19
19 -
 20
20 -
 21
21 -
 22
22 -
 23
23 -
 24
24 -
 25
25 -
 26
26 -
 27
27 -
 28
28 -
 29
29 -
 30
30 -
 31
31 -
 32
32 -
33
-
34
-
35
-
36
-
37
-
38
-
39
-
40
-
41
-
42
-
43
-
44
-
45
-
46
-
47
-
48
-
49
-
50
-
51
-
52
-
53
-
54
-
55
-
56
 |
 |

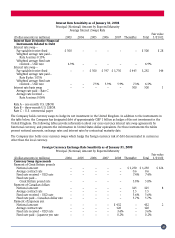
The non-amortization provisions of FAS 142 had an overall positive impact on our effective income tax rate for fiscal 2003.
Our effective income tax rate for fiscal 2003 was 35.3% compared with an effective income tax rate of 36.2% for fiscal
2002. Had the accounting standard been in place for fiscal 2002, the effective income tax rate would have been reduced
by 0.7% from 36.2% to 35.5% for that fiscal year. The remainder of the reduction in the effective income tax rate resulted
from a variety of factors, but predominately from the changing mix of results of operations of our subsidiaries in foreign
countries, which have disparate tax rates.
In mid-October 2002 the German government proposed a number of tax law changes and spending cuts, with an expected
vote in the first half of calendar 2003. We previously recorded a deferred tax asset related to our tax loss carry-forwards in
Germany. The proposals include provisions which, if enacted, may limit the usage of such tax loss carry-forwards in any
one year.
During July 2001, we acquired the outstanding minority interest in Wal-Mart.com, Inc. from Accel Partners and a small
group of other investors. A reorganization resulting from the acquisition resulted in a charge against the earnings of the
Company during fiscal 2002 of slightly less than $0.01 per share.
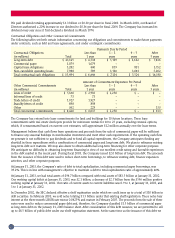
Wal-Mart Stores Segment
Segment Net Sales Increase Segment Operating Segment Operating Income Operating Income as a
Fiscal Year from Prior Fiscal Year Income (in Billions) Increase from Prior Year Percentage of Segment Sales
2003 12.9% $ 11.9 16.2% 7.6%
2002 14.1% $ 10.2 6.3% 7.3%
2001 12.1% $ 9.6 10.5% 7.9%
The Wal-Mart Stores segment net sales amounted to 64.3% of total Company net sales in fiscal 2003, which compares
to 63.9% in fiscal 2002 and 63.7% in fiscal 2001.
The segment net sales increases in fiscal 2003 and fiscal 2002 from the prior fiscal years resulted from comparative
store sales increases of 5.7% in fiscal 2003 and 5.9% in fiscal 2002, and our expansion program in the Wal-Mart Stores
segment. Segment expansion during fiscal 2003 included the opening of 43 Wal-Mart stores, 18 Neighborhood Markets
and 192 Supercenters (including the conversion of 122 existing Wal-Mart stores into Supercenters) and added 32.1 million
(or 9.0%) of additional store square footage. Segment expansion during fiscal 2002 included the opening of 33 Wal-Mart
stores, 12 Neighborhood Markets and 178 Supercenters (including the conversion of 121 existing Wal-Mart stores into
Supercenters) and added 27.7 million (or 8.4%) of additional store square footage.
The fiscal 2003 increase in segment operating income as a percentage of segment sales resulted from a 0.20% improvement
in gross margin which was partially offset by a 0.04% increase in SG&A expenses as a percentage of segment sales
compared with fiscal 2002. The gross margin improvement was driven primarily by an improvement in the mix of products
sold and reductions in shrinkage and markdowns. We continue to see increases in our lower-margin food sales as a
percentage of total segment sales, which puts downward pressure on our gross margin. As more discount stores are
converted to Supercenters and new Supercenters and Neighborhood Markets are opened, we expect to see further increases
in food sales as a percentage of total segment sales. Segment expenses in fiscal 2003 as a percent of sales were higher than
fiscal 2002 due primarily to increased insurance costs throughout the year and late in the fiscal year, utility costs.
A reduction in gross margin and an increase in operating expenses caused the decrease in segment operating income as
a percent of segment sales in fiscal 2002 when compared to fiscal 2001. The gross margin reduction was driven primarily
by an increase in lower-margin food sales as a percentage of total segment sales and a change in customer buying patterns
to lower-margin merchandise. Segment expenses in fiscal 2002 as a percent of sales were higher than fiscal 2001 due
primarily to increased Associate wages, utility, repairs and maintenance expenses and insurance costs.
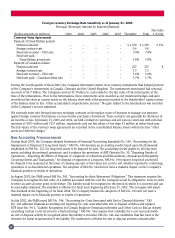
SAM’S CLUB Segment
Segment Net Sales Increase Segment Operating Segment Operating Income Operating Income as a
Fiscal year from Prior Fiscal Year Income (in Billions) Increase from Prior Year Percentage of Segment Sales
2003 7.8% $ 1.028 0.0% 3.2%
2002 9.7% $ 1.028 9.1% 3.5%
2001 8.1% $ 0.942 10.8% 3.5%
20