Walmart 2003 Annual Report Download - page 35
Download and view the complete annual report
Please find page 35 of the 2003 Walmart annual report below. You can navigate through the pages in the report by either clicking on the pages listed below, or by using the keyword search tool below to find specific information within the annual report.-
 1
1 -
2
-
3
-
4
-
5
-
6
-
7
-
8
-
9
-
10
-
11
-
12
-
13
-
14
-
15
-
16
-
17
-
18
-
19
-
20
-
21
-
22
-
23
-
24
-
 25
25 -
 26
26 -
 27
27 -
 28
28 -
 29
29 -
 30
30 -
 31
31 -
 32
32 -
 33
33 -
 34
34 -
 35
35 -
 36
36 -
 37
37 -
 38
38 -
 39
39 -
 40
40 -
 41
41 -
 42
42 -
 43
43 -
 44
44 -
 45
45 -
46
-
47
-
48
-
49
-
50
-
51
-
52
-
53
-
54
-
55
-
56
 |
 |

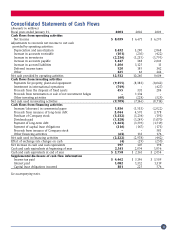
Consolidated Statements of Cash Flows
(Amounts in millions)
Fiscal years ended January 31, 2003 2002 2001
Cash flows from operating activities
Net Income $ 8,039 $ 6,671 $ 6,295
Adjustments to reconcile net income to net cash
provided by operating activities:
Depreciation and amortization 3,432 3,290 2,868
Increase in accounts receivable (101) (210) (422)
Increase in inventories (2,236) (1,235) (1,795)
Increase in accounts payable 1,447 368 2,061
Increase in accrued liabilities 1,106 1,125 11
Deferred income taxes 520 185 342
Other 325 66 244
Net cash provided by operating activities 12,532 10,260 9,604
Cash flows from investing activities
Payments for property, plant and equipment (9,355) (8,383) (8,042)
Investment in international operations (749) – (627)
Proceeds from the disposal of fixed assets 455 331 284
Proceeds from termination or sale of net investment hedges –1,134 –
Other investing activities (60) (228) (329)
Net cash used in investing activities (9,709) (7,146) (8,714)
Cash flows from financing activities
Increase/(decrease) in commercial paper 1,836 (1,533) (2,022)
Proceeds from issuance of long-term debt 2,044 4,591 3,778
Purchase of Company stock (3,232) (1,214) (193)
Dividends paid (1,328) (1,249) (1,070)
Payment of long-term debt (1,263) (3,519) (1,519)
Payment of capital lease obligations (216) (167) (173)
Proceeds from issuance of Company stock ––581
Other financing activities (63) 113 176
Net cash used in financing activities (2,222) (2,978) (442)
Effect of exchange rate changes on cash (4) (29) (250)
Net increase in cash and cash equivalents 597 107 198
Cash and cash equivalents at beginning of year 2,161 2,054 1,856
Cash and cash equivalents at end of year $ 2,758 $ 2,161 $ 2,054
Supplemental disclosure of cash flow information
Income tax paid $ 4,462 $3,196 $3,509
Interest paid 1,082 1,312 1,319
Capital lease obligations incurred 381 225 576
See accompanying notes.
33