Walgreens 2015 Annual Report Download - page 86
Download and view the complete annual report
Please find page 86 of the 2015 Walgreens annual report below. You can navigate through the pages in the report by either clicking on the pages listed below, or by using the keyword search tool below to find specific information within the annual report.-
 1
1 -
2
-
3
-
4
-
5
-
6
-
7
-
8
-
9
-
10
-
11
-
12
-
13
-
14
-
15
-
16
-
17
-
18
-
19
-
20
-
21
-
22
-
23
-
24
-
25
-
26
-
27
-
28
-
29
-
30
-
31
-
32
-
33
-
34
-
35
-
36
-
37
-
38
-
39
-
40
-
41
-
42
-
43
-
44
-
45
-
46
-
47
-
48
-
49
-
50
-
51
-
52
-
53
-
54
-
55
-
56
-
57
-
58
-
59
-
60
-
61
-
62
-
63
-
64
-
65
-
66
-
67
-
68
-
69
-
70
-
71
-
72
-
73
-
74
-
75
-
 76
76 -
 77
77 -
 78
78 -
 79
79 -
 80
80 -
 81
81 -
 82
82 -
 83
83 -
 84
84 -
 85
85 -
 86
86 -
 87
87 -
 88
88 -
 89
89 -
 90
90 -
 91
91 -
 92
92 -
 93
93 -
 94
94 -
 95
95 -
 96
96 -
97
-
98
-
99
-
100
-
101
-
102
-
103
-
104
-
105
-
106
-
107
-
108
-
109
-
110
-
111
-
112
-
113
-
114
-
115
-
116
-
117
-
118
-
119
-
120
-
121
-
122
-
123
-
124
-
125
-
126
-
127
-
128
-
129
-
130
-
131
-
132
-
133
-
134
-
135
-
136
-
137
-
138
-
139
-
140
-
141
-
142
-
143
-
144
-
145
-
146
-
147
-
148
 |
 |

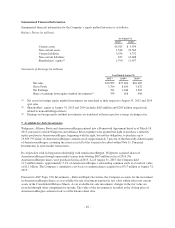
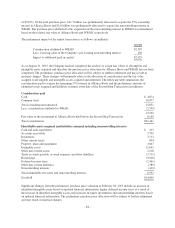
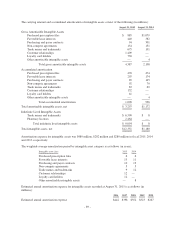
Summarized Financial Information
Summarized financial information for the Company’s equity method investees is as follows:
Balance Sheets (in millions)
At August 31,
2015(1) 2014(1)
Current assets $5,015 $ 9,074
Non-current assets 1,548 22,363
Current liabilities 3,936 9,372
Non-current liabilities 837 10,608
Shareholders’ equity(2) 1,790 11,457
Statements of Earnings (in millions)
Year Ended August 31,
2015(3) 2014(3) 2013(3)
Net sales $20,905 $37,624 $36,482
Gross Profit 3,794 8,109 7,632
Net Earnings 791 1,446 1,363
Share of earnings from equity method investments(3) 339 618 496
(1) Net assets in foreign equity method investments are translated at their respective August 31, 2015 and 2014
spot rates.
(2) Shareholders’ equity at August 31, 2015 and 2014 includes $163 million and $283 million respectively,
related to noncontrolling interests.
(3) Earnings in foreign equity method investments are translated at their respective average exchange rates.
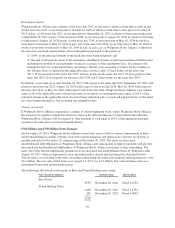
7. Available-for-Sale Investments
Walgreens, Alliance Boots and AmerisourceBergen entered into a Framework Agreement dated as of March 18,
2013, pursuant to which Walgreens and Alliance Boots together were granted the right to purchase a minority
equity position in AmerisourceBergen, beginning with the right, but not the obligation, to purchase up to
19,859,795 shares of AmerisourceBergen common stock (approximately 7 percent of the then fully diluted equity
of AmerisourceBergen, assuming the exercise in full of the warrants described within Note 11, Financial
Instruments) in open market transactions.
In conjunction with its long-term relationship with AmerisourceBergen, Walgreens acquired shares of
AmerisourceBergen through open market transactions totaling $493 million in fiscal 2014. No
AmerisourceBergen shares were purchased in fiscal 2015. As of August 31, 2015, the Company held
11.5 million shares, approximately 5.2% of AmerisourceBergen’s outstanding common stock at a total fair value
of $1.1 billion. The Company’s cumulative cost basis of common shares acquired was $717 million at August 31,
2015.
Pursuant to ASC Topic 320, Investments – Debt and Equity Securities, the Company accounts for the investment
in AmerisourceBergen shares as an available-for-sale investment reported at fair value within other non-current
assets in the Consolidated Balance Sheets. As an available-for-sale investment, changes in the fair value are
recorded through other comprehensive income. The value of the investment is recorded at the closing price of
AmerisourceBergen common stock as of the balance sheet date.
-82-