Walgreens 2015 Annual Report Download - page 49
Download and view the complete annual report
Please find page 49 of the 2015 Walgreens annual report below. You can navigate through the pages in the report by either clicking on the pages listed below, or by using the keyword search tool below to find specific information within the annual report.-
 1
1 -
2
-
3
-
4
-
5
-
6
-
7
-
8
-
9
-
10
-
11
-
12
-
13
-
14
-
15
-
16
-
17
-
18
-
19
-
20
-
21
-
22
-
23
-
24
-
25
-
26
-
27
-
28
-
29
-
30
-
31
-
32
-
33
-
34
-
35
-
36
-
37
-
38
-
 39
39 -
 40
40 -
 41
41 -
 42
42 -
 43
43 -
 44
44 -
 45
45 -
 46
46 -
 47
47 -
 48
48 -
 49
49 -
 50
50 -
 51
51 -
 52
52 -
 53
53 -
 54
54 -
 55
55 -
 56
56 -
 57
57 -
 58
58 -
 59
59 -
60
-
61
-
62
-
63
-
64
-
65
-
66
-
67
-
68
-
69
-
70
-
71
-
72
-
73
-
74
-
75
-
76
-
77
-
78
-
79
-
80
-
81
-
82
-
83
-
84
-
85
-
86
-
87
-
88
-
89
-
90
-
91
-
92
-
93
-
94
-
95
-
96
-
97
-
98
-
99
-
100
-
101
-
102
-
103
-
104
-
105
-
106
-
107
-
108
-
109
-
110
-
111
-
112
-
113
-
114
-
115
-
116
-
117
-
118
-
119
-
120
-
121
-
122
-
123
-
124
-
125
-
126
-
127
-
128
-
129
-
130
-
131
-
132
-
133
-
134
-
135
-
136
-
137
-
138
-
139
-
140
-
141
-
142
-
143
-
144
-
145
-
146
-
147
-
148
 |
 |

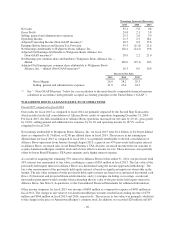
Gross margin as a percent of total sales was 28.2% in fiscal 2014, compared to 29.3% in fiscal 2013. Gross
margin in fiscal 2014 was negatively impacted by lower retail pharmacy margins primarily from lower third-
party reimbursement; the increase in Medicare Part D mix and the strategy to continue driving 90-day
prescriptions at retail; fewer brand-to-generic drug conversions compared with the prior year period; generic drug
inflation on a subset of generic drugs; and the mix of specialty drugs, which carry a lower margin percentage.
Retail margins were negatively impacted in the photofinishing, non-prescription drug and convenience and fresh
foods categories. Pharmacy and retail margin decreases were partially offset by purchasing synergies realized
from WBAD and a lower provision for LIFO in fiscal 2014.
Selling, general and administrative expenses were 23.6% of total sales in fiscal 2014, compared to 24.3% of total
sales in fiscal 2013. As a percentage of total sales, expenses were lower primarily due to lower store
compensation costs, store occupancy costs and headquarters costs, partially offset by costs related to our store
optimization plan.
Adjusted Operating Income (Non-GAAP measure) fiscal 2014 compared to fiscal 2013
Retail Pharmacy USA division’s adjusted operating income for fiscal 2014 was $4.9 billion, an increase of 0.8%
compared to fiscal 2013. The increase is primarily due to higher sales and lower selling, general and
administrative expenses as a percent of sales partially offset by lower gross margins. See “– Non-GAAP
Measures” below for a reconciliation to the most directly comparable GAAP measure.
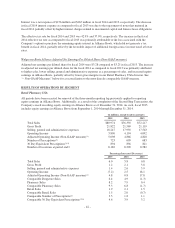
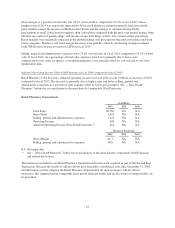
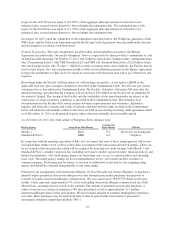
Retail Pharmacy International
(in millions)
2015 2014 2013
Total Sales $8,781 NA NA
Gross Profit 3,623 NA NA
Selling, general and administrative expenses 3,214 NA NA
Operating Income 409 NA NA
Adjusted Operating Income (Non-GAAP measure)(1) 616 NA NA
Percent to Total Sales
2015 2014 2013
Gross Margin 41.3 NA NA
Selling, general and administrative expenses 36.6 NA NA
NA Not applicable
(1) See “– Non-GAAP Measures” below for reconciliations to the most directly comparable GAAP measure
and related disclosures.
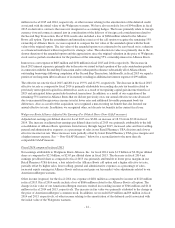
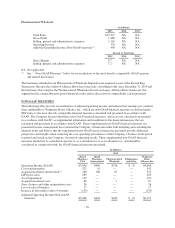
The businesses included in our Retail Pharmacy International division were acquired as part of the Second Step
Transaction. Because the results of Alliance Boots have been fully consolidated only since December 31, 2014
and the businesses that comprise the Retail Pharmacy International division are legacy Alliance Boots
businesses, this segment had no comparable prior period financial results and no discussion of comparability can
be presented.
-45-