Walgreens 2015 Annual Report Download - page 53
Download and view the complete annual report
Please find page 53 of the 2015 Walgreens annual report below. You can navigate through the pages in the report by either clicking on the pages listed below, or by using the keyword search tool below to find specific information within the annual report.-
 1
1 -
2
-
3
-
4
-
5
-
6
-
7
-
8
-
9
-
10
-
11
-
12
-
13
-
14
-
15
-
16
-
17
-
18
-
19
-
20
-
21
-
22
-
23
-
24
-
25
-
26
-
27
-
28
-
29
-
30
-
31
-
32
-
33
-
34
-
35
-
36
-
37
-
38
-
39
-
40
-
41
-
42
-
 43
43 -
 44
44 -
 45
45 -
 46
46 -
 47
47 -
 48
48 -
 49
49 -
 50
50 -
 51
51 -
 52
52 -
 53
53 -
 54
54 -
 55
55 -
 56
56 -
 57
57 -
 58
58 -
 59
59 -
 60
60 -
 61
61 -
 62
62 -
 63
63 -
64
-
65
-
66
-
67
-
68
-
69
-
70
-
71
-
72
-
73
-
74
-
75
-
76
-
77
-
78
-
79
-
80
-
81
-
82
-
83
-
84
-
85
-
86
-
87
-
88
-
89
-
90
-
91
-
92
-
93
-
94
-
95
-
96
-
97
-
98
-
99
-
100
-
101
-
102
-
103
-
104
-
105
-
106
-
107
-
108
-
109
-
110
-
111
-
112
-
113
-
114
-
115
-
116
-
117
-
118
-
119
-
120
-
121
-
122
-
123
-
124
-
125
-
126
-
127
-
128
-
129
-
130
-
131
-
132
-
133
-
134
-
135
-
136
-
137
-
138
-
139
-
140
-
141
-
142
-
143
-
144
-
145
-
146
-
147
-
148
 |
 |

LIQUIDITY AND CAPITAL RESOURCES
Cash and cash equivalents were $3.0 billion (including $1.7 billion in foreign jurisdictions) as of August 31,
2015, compared to $2.6 billion (including $177 million in foreign jurisdictions) as of August 31, 2014. Short-
term investment objectives are primarily to minimize risk and maintain liquidity. To attain these objectives,
investment limits are placed on the amount, type and issuer of securities. Investments are principally in U.S.
Treasury market funds and AAA rated money market funds.
Our long-term capital policy is to maintain a strong balance sheet and financial flexibility; reinvest in our core
strategies; invest in strategic opportunities that reinforce our core strategies and meet return requirements; and
return surplus cash flow to shareholders in the form of dividends and share repurchases over the long term.
Cash provided by operations and the issuance of debt are the principal sources of funds for expansion,
investments, acquisitions, remodeling programs, dividends to shareholders and stock repurchases. Net cash
provided by operating activities was $5.7 billion in fiscal 2015 compared to $3.9 billion in fiscal 2014 and $4.3
billion in fiscal 2013. The increase in fiscal 2015 cash provided by operating activities was primarily a result of
higher net earnings as a result of the inclusion of Alliance Boots operations on a fully-consolidated basis from
January to August and working capital improvements compared to the prior fiscal year.
Net cash used for investing activities was $4.3 billion in fiscal 2015 compared to $1.7 billion in fiscal 2014 and
$2.0 billion in fiscal 2013. The acquisition of the remaining 55% of Alliance Boots that we did not previously
own used $4.5 billion of cash in fiscal 2015. Other business acquisitions in fiscal 2015 were $371 million versus
$344 million in fiscal 2014 and $630 million in fiscal 2013. Other business acquisitions in fiscal 2015 included
Liz Earle Beauty Co. Ltd. in addition to other asset acquisitions, primarily pharmacy prescription files. Other
business acquisitions in fiscal 2014 included the purchase of the U.S. regional drugstore chain Kerr Drug and
affiliates and the purchase of pharmacy prescription files. Other business acquisitions in fiscal 2013 included the
purchase of the regional drugstore chain USA Drug from Stephen L. LaFrance Holdings, Inc. and members of
the LaFrance family, an 80% interest in Cystic Fibrosis Foundation Pharmacy, LLC, and the purchase of
pharmacy prescription files.
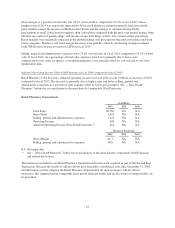
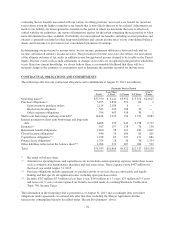
Additions to property, plant and equipment in fiscal 2015 were $1.3 billion compared to $1.1 billion in fiscal
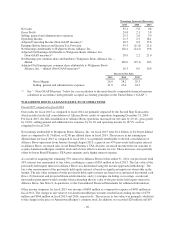
2014 and $1.2 billion in fiscal 2013. Capital expenditures by reporting segment were as follows:
2015 2014 2013
Retail Pharmacy USA $ 951 $1,106 $1,212
Retail Pharmacy International(1) 249 — —
Pharmaceutical Wholesale(1) 51 — —
Total $1,251 $1,106 $1,212
(1) Our Retail Pharmacy International and Pharmaceutical Wholesale segments were acquired as part of the
Second Step Transaction in which we acquired the 55% of Alliance Boots that we did not already own on
December 31, 2014. As a result of the timing of the acquisition, only eight months (January through August
2015) of capital expenditures have been reported.
Our Retail Pharmacy USA segment opened, relocated or acquired 133 locations in fiscal 2015 compared to 268
locations in fiscal 2014 and 350 locations in fiscal 2013. Fiscal 2014 acquisitions included Kerr Drug, which
contributed 76 drugstore locations as well as a specialty pharmacy and a distribution center. Fiscal 2013
acquisitions included the acquisition of 141 USA Drug locations. Significant Retail Pharmacy International
capital expenditures in fiscal 2015 primarily relate to investments in our stores and information technology
projects. Pharmaceutical Wholesale capital expenditures in fiscal 2015 primarily relate to information technology
projects.
-49-