Walgreens 2015 Annual Report Download - page 50
Download and view the complete annual report
Please find page 50 of the 2015 Walgreens annual report below. You can navigate through the pages in the report by either clicking on the pages listed below, or by using the keyword search tool below to find specific information within the annual report.-
 1
1 -
2
-
3
-
4
-
5
-
6
-
7
-
8
-
9
-
10
-
11
-
12
-
13
-
14
-
15
-
16
-
17
-
18
-
19
-
20
-
21
-
22
-
23
-
24
-
25
-
26
-
27
-
28
-
29
-
30
-
31
-
32
-
33
-
34
-
35
-
36
-
37
-
38
-
39
-
 40
40 -
 41
41 -
 42
42 -
 43
43 -
 44
44 -
 45
45 -
 46
46 -
 47
47 -
 48
48 -
 49
49 -
 50
50 -
 51
51 -
 52
52 -
 53
53 -
 54
54 -
 55
55 -
 56
56 -
 57
57 -
 58
58 -
 59
59 -
 60
60 -
61
-
62
-
63
-
64
-
65
-
66
-
67
-
68
-
69
-
70
-
71
-
72
-
73
-
74
-
75
-
76
-
77
-
78
-
79
-
80
-
81
-
82
-
83
-
84
-
85
-
86
-
87
-
88
-
89
-
90
-
91
-
92
-
93
-
94
-
95
-
96
-
97
-
98
-
99
-
100
-
101
-
102
-
103
-
104
-
105
-
106
-
107
-
108
-
109
-
110
-
111
-
112
-
113
-
114
-
115
-
116
-
117
-
118
-
119
-
120
-
121
-
122
-
123
-
124
-
125
-
126
-
127
-
128
-
129
-
130
-
131
-
132
-
133
-
134
-
135
-
136
-
137
-
138
-
139
-
140
-
141
-
142
-
143
-
144
-
145
-
146
-
147
-
148
 |
 |

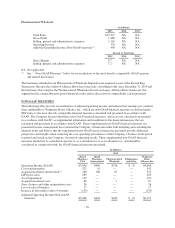
Pharmaceutical Wholesale
(in millions)
2015 2014 2013
Total Sales $15,327 NA NA
Gross Profit 1,486 NA NA
Selling, general and administrative expenses 1,110 NA NA
Operating Income 376 NA NA
Adjusted Operating Income (Non-GAAP measure)(1) 450 NA NA
Percent to Total Sales
2015 2014 2013
Gross Margin 9.7 NA NA
Selling, general and administrative expenses 7.2 NA NA
NA Not applicable
(1) See “– Non-GAAP Measures” below for reconciliations to the most directly comparable GAAP measure
and related disclosures.
The businesses included in our Pharmaceutical Wholesale Segment were acquired as part of the Second Step
Transaction. Because the results of Alliance Boots have been fully consolidated only since December 31, 2014 and
the businesses that comprise the Pharmaceutical Wholesale division are legacy Alliance Boots businesses, this
segment had no comparable prior period financial results and no discussion of comparability can be presented.
NON-GAAP MEASURES
The following tables provide reconciliations of adjusted operating income and adjusted net earnings per common
share attributable to Walgreens Boots Alliance, Inc., which are non-GAAP financial measures as defined under
SEC rules, to the most directly comparable financial measures calculated and presented in accordance with
GAAP. The Company has provided these non-GAAP financial measures, which are not calculated or presented
in accordance with GAAP, as supplemental information and in addition to the financial measures that are
calculated and presented in accordance with GAAP. These supplemental non-GAAP financial measures are
presented because management has evaluated the Company’s financial results both including and excluding the
adjusted items and believe that the supplemental non-GAAP financial measures presented provide additional
perspective and insights when analyzing the core operating performance of the Company’s business from period
to period and trends in the Company’s historical operating results. These supplemental non-GAAP financial
measures should not be considered superior to, as a substitute for or as an alternative to, and should be
considered in conjunction with, the GAAP financial measures presented.
(in millions)
2015
Retail
Pharmacy
USA
Retail
Pharmacy
International
Pharmaceutical
Wholesale
Eliminations
and Other
Walgreens
Boots
Alliance, Inc.
Operating Income (GAAP) $3,890 $409 $376 $ (7) $4,668
Cost transformation 523 19 — — 542
Acquisition-related amortization(1) 260 188 67 — 515
LIFO provision 285 — — — 285
Asset impairment 110 — — — 110
Acquisition-related costs 80 — 7 — 87
Store closures and other optimization costs 56 — — — 56
Loss on sale of business 17 — — — 17
Increase in fair market value of warrants (123) — — — (123)
Adjusted Operating Income (Non-GAAP
measure) $5,098 $616 $450 $ (7) $6,157
-46-