Walgreens 2015 Annual Report Download - page 120
Download and view the complete annual report
Please find page 120 of the 2015 Walgreens annual report below. You can navigate through the pages in the report by either clicking on the pages listed below, or by using the keyword search tool below to find specific information within the annual report.-
 1
1 -
2
-
3
-
4
-
5
-
6
-
7
-
8
-
9
-
10
-
11
-
12
-
13
-
14
-
15
-
16
-
17
-
18
-
19
-
20
-
21
-
22
-
23
-
24
-
25
-
26
-
27
-
28
-
29
-
30
-
31
-
32
-
33
-
34
-
35
-
36
-
37
-
38
-
39
-
40
-
41
-
42
-
43
-
44
-
45
-
46
-
47
-
48
-
49
-
50
-
51
-
52
-
53
-
54
-
55
-
56
-
57
-
58
-
59
-
60
-
61
-
62
-
63
-
64
-
65
-
66
-
67
-
68
-
69
-
70
-
71
-
72
-
73
-
74
-
75
-
76
-
77
-
78
-
79
-
80
-
81
-
82
-
83
-
84
-
85
-
86
-
87
-
88
-
89
-
90
-
91
-
92
-
93
-
94
-
95
-
96
-
97
-
98
-
99
-
100
-
101
-
102
-
103
-
104
-
105
-
106
-
107
-
108
-
109
-
 110
110 -
 111
111 -
 112
112 -
 113
113 -
 114
114 -
 115
115 -
 116
116 -
 117
117 -
 118
118 -
 119
119 -
 120
120 -
 121
121 -
 122
122 -
 123
123 -
 124
124 -
 125
125 -
 126
126 -
 127
127 -
 128
128 -
 129
129 -
 130
130 -
131
-
132
-
133
-
134
-
135
-
136
-
137
-
138
-
139
-
140
-
141
-
142
-
143
-
144
-
145
-
146
-
147
-
148
 |
 |

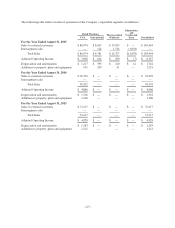
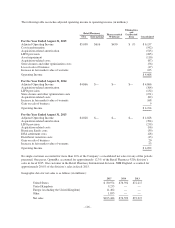
The following table reconciles adjusted operating income to operating income (in millions):
Retail Pharmacy Pharmaceutical
Wholesale
Eliminations
and
Unallocated
Items ConsolidatedUSA International
For the Year Ended August 31, 2015
Adjusted Operating Income $5,098 $616 $450 $ (7) $ 6,157
Cost transformation (542)
Acquisition-related amortization (515)
LIFO provision (285)
Asset impairment (110)
Acquisition-related costs (87)
Store closures and other optimization costs (56)
Loss on sale of business (17)
Increase in fair market value of warrants 123
Operating Income $ 4,668
For the Year Ended August 31, 2014
Adjusted Operating Income $4,866 $— $— $— $ 4,866
Acquisition-related amortization (364)
LIFO provision (132)
Store closure and other optimization costs (271)
Acquisition-related costs (82)
Increase in fair market value of warrants 168
Gain on sale of business 9
Operating Income $ 4,194
For the Year Ended August 31, 2013
Adjusted Operating Income $4,828 $— $— $— $ 4,828
Acquisition-related amortization (394)
LIFO provision (239)
Acquisition-related costs (96)
Hurricane Sandy costs (39)
DEA settlement costs (28)
Distributor transition costs (13)
Gain on sale of business 20
Increase in fair market value of warrants 53
Operating Income $ 4,092
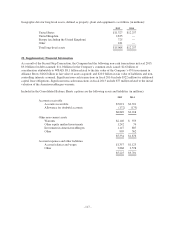
No single customer accounted for more than 10% of the Company’s consolidated net sales for any of the periods
presented. One payer, OptumRx, accounted for approximately 12.3% of the Retail Pharmacy USA division’s
sales in fiscal 2015. One customer in the Retail Pharmacy International division, NHS England, accounted for
approximately 20.0% of the division’s sales in fiscal 2015.
Geographic data for net sales is as follows (in millions):
2015 2014 2013
United States $ 80,974 $76,392 $72,217
United Kingdom 9,235 — —
Europe (excluding the United Kingdom) 11,402 — —
Other 1,833 — —
Net sales $103,444 $76,392 $72,217
- 116 -