Walgreens 2015 Annual Report Download - page 48
Download and view the complete annual report
Please find page 48 of the 2015 Walgreens annual report below. You can navigate through the pages in the report by either clicking on the pages listed below, or by using the keyword search tool below to find specific information within the annual report.-
 1
1 -
2
-
3
-
4
-
5
-
6
-
7
-
8
-
9
-
10
-
11
-
12
-
13
-
14
-
15
-
16
-
17
-
18
-
19
-
20
-
21
-
22
-
23
-
24
-
25
-
26
-
27
-
28
-
29
-
30
-
31
-
32
-
33
-
34
-
35
-
36
-
37
-
 38
38 -
 39
39 -
 40
40 -
 41
41 -
 42
42 -
 43
43 -
 44
44 -
 45
45 -
 46
46 -
 47
47 -
 48
48 -
 49
49 -
 50
50 -
 51
51 -
 52
52 -
 53
53 -
 54
54 -
 55
55 -
 56
56 -
 57
57 -
 58
58 -
59
-
60
-
61
-
62
-
63
-
64
-
65
-
66
-
67
-
68
-
69
-
70
-
71
-
72
-
73
-
74
-
75
-
76
-
77
-
78
-
79
-
80
-
81
-
82
-
83
-
84
-
85
-
86
-
87
-
88
-
89
-
90
-
91
-
92
-
93
-
94
-
95
-
96
-
97
-
98
-
99
-
100
-
101
-
102
-
103
-
104
-
105
-
106
-
107
-
108
-
109
-
110
-
111
-
112
-
113
-
114
-
115
-
116
-
117
-
118
-
119
-
120
-
121
-
122
-
123
-
124
-
125
-
126
-
127
-
128
-
129
-
130
-
131
-
132
-
133
-
134
-
135
-
136
-
137
-
138
-
139
-
140
-
141
-
142
-
143
-
144
-
145
-
146
-
147
-
148
 |
 |

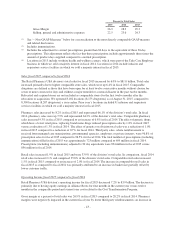
Medicare Part D mix including the strategy to continue driving 90-day prescriptions at retail; and the mix of
specialty drugs, which carry a lower margin percentage. The decrease in pharmacy margins was partially offset
by additional brand-to-generic drug conversions compared with the prior fiscal year. Retail margins were
positively impacted in fiscal 2015 primarily from the non-prescription drug, beauty and beverage and snack
categories partially offset by the electronics category.
Selling, general and administrative expenses as a percentage of total sales were 22.5% in fiscal 2015 compared to
23.6% in fiscal 2014. As a percentage of total sales, expenses in fiscal 2015 were lower primarily due to store
labor efficiencies partially offset by higher costs related to the Cost Transformation Program.
Adjusted Operating Income (Non-GAAP measure) fiscal 2015 compared to fiscal 2014
Retail Pharmacy USA division’s adjusted operating income for fiscal 2015 increased 4.8% to $5.1 billion. The
increase is primarily due to higher sales and lower selling, general and administrative expenses as a percentage of
sales partially offset by having four months of equity earnings in Alliance Boots in fiscal 2015 versus twelve
months in fiscal 2014 and lower gross margins. See “– Non-GAAP Measures” below for a reconciliation to the
most directly comparable GAAP measure.
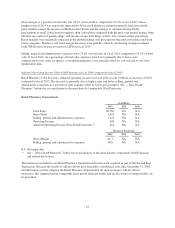
Sales fiscal 2014 compared to fiscal 2013
The Retail Pharmacy USA division’s total sales for fiscal 2014 increased by 5.8% to $76.4 billion. Total sales
increased from new stores, each of which includes an indeterminate amount of market-driven price changes, and
higher comparable store sales. Sales in comparable drugstores were up 4.9% in fiscal 2014 compared to a
decrease of 1.3% in fiscal 2013. We operated 8,309 locations (8,207 drugstores) as of August 31, 2014,
compared to 8,582 locations (8,116 drugstores) at August 31, 2013. Included in fiscal 2013 locations were 371
worksite health and wellness centers, which were part of the Take Care Employer business in which we sold a
majority interest in fiscal 2014.
Pharmacy sales increased by 7.9% in fiscal 2014 and represented 64.2% of the division’s total sales. In fiscal
2013, pharmacy sales were up 0.4% and represented 62.9% of the division’s total sales. Comparable pharmacy
sales were up 6.8% in fiscal 2014 compared to a decrease of 1.7% in fiscal 2013. The effect of generic drugs,
which have a lower retail price, replacing brand name drugs reduced prescription sales by 1.3% in fiscal 2014
versus a reduction of 5.3% in fiscal 2013. The effect of generics on division total sales was a reduction of 0.7%
in fiscal 2014 compared to a reduction of 3.0% for fiscal 2013. Third party sales, where reimbursement is
received from managed care organizations, governmental agencies, employers or private insurers, were 96.5% of
prescription sales for fiscal 2014 compared to 95.8% for fiscal 2013. The total number of prescriptions (including
immunizations) filled in fiscal 2014 was approximately 699 million compared to 683 million in fiscal 2013.
Prescriptions (including immunizations) adjusted to 30 day equivalents were 856 million in fiscal 2014 versus
821 million in fiscal 2013.
Retail sales increased 2.1% in fiscal 2014 and were 35.8% of the division’s total sales. In comparison, fiscal 2013
retail sales increased 1.5% and comprised 37.1% of the division’s total sales. Comparable retail sales increased
2.0% in fiscal 2014 compared to a decrease of 0.7% in fiscal 2013. The increase in comparable retail sales in
fiscal 2014 as compared to fiscal 2013 was primarily attributed to an increase in basket size partially offset by
lower customer traffic.
Operating Income fiscal 2014 compared to fiscal 2013
Retail Pharmacy USA division’s operating income for fiscal 2014 was $4.2 billion, an increase of 2.5%
compared to fiscal 2013. The increase is primarily due to higher sales and increased equity earnings in Alliance
Boots, partially offset by lower gross margins.
-44-