Walgreens 2015 Annual Report Download - page 38
Download and view the complete annual report
Please find page 38 of the 2015 Walgreens annual report below. You can navigate through the pages in the report by either clicking on the pages listed below, or by using the keyword search tool below to find specific information within the annual report.-
 1
1 -
2
-
3
-
4
-
5
-
6
-
7
-
8
-
9
-
10
-
11
-
12
-
13
-
14
-
15
-
16
-
17
-
18
-
19
-
20
-
21
-
22
-
23
-
24
-
25
-
26
-
27
-
 28
28 -
 29
29 -
 30
30 -
 31
31 -
 32
32 -
 33
33 -
 34
34 -
 35
35 -
 36
36 -
 37
37 -
 38
38 -
 39
39 -
 40
40 -
 41
41 -
 42
42 -
 43
43 -
 44
44 -
 45
45 -
 46
46 -
 47
47 -
 48
48 -
49
-
50
-
51
-
52
-
53
-
54
-
55
-
56
-
57
-
58
-
59
-
60
-
61
-
62
-
63
-
64
-
65
-
66
-
67
-
68
-
69
-
70
-
71
-
72
-
73
-
74
-
75
-
76
-
77
-
78
-
79
-
80
-
81
-
82
-
83
-
84
-
85
-
86
-
87
-
88
-
89
-
90
-
91
-
92
-
93
-
94
-
95
-
96
-
97
-
98
-
99
-
100
-
101
-
102
-
103
-
104
-
105
-
106
-
107
-
108
-
109
-
110
-
111
-
112
-
113
-
114
-
115
-
116
-
117
-
118
-
119
-
120
-
121
-
122
-
123
-
124
-
125
-
126
-
127
-
128
-
129
-
130
-
131
-
132
-
133
-
134
-
135
-
136
-
137
-
138
-
139
-
140
-
141
-
142
-
143
-
144
-
145
-
146
-
147
-
148
 |
 |

PART II
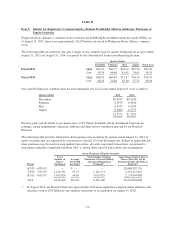
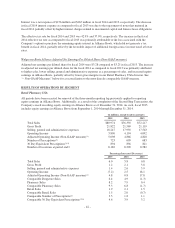
Item 5. Market for Registrant’s Common Equity, Related Stockholder Matters and Issuer Purchases of
Equity Securities
Walgreens Boots Alliance’s common stock is listed on the NASDAQ Stock Market under the symbol WBA. As
of August 31, 2015, there were approximately 70,250 holders of record of Walgreens Boots Alliance common
stock.
The following table sets forth the sales price ranges of our common stock by quarter during the fiscal years ended
August 31, 2015 and August 31, 2014 as reported by the Consolidated Transaction Reporting System.
Quarter Ended
November February May August Fiscal Year
Fiscal 2015 High $69.37 $83.77 $93.42 $97.30 $97.30
Low 58.39 66.46 81.01 76.01 58.39
Fiscal 2014 High $60.93 $69.84 $71.97 $76.39 $76.39
Low 48.18 54.86 62.80 57.75 48.18
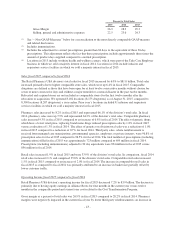
Our cash dividends per common share declared during the two fiscal years ended August 31 were as follows:
Quarter Ended 2015 2014
November $0.3375 $0.3150
February 0.3375 0.3150
May 0.3375 0.3150
August 0.3600 0.3375
$1.3725 $1.2825
We have paid cash dividends every quarter since 1933. Future dividends will be determined based on our
earnings, capital requirements, financial condition and other factors considered relevant by our Board of
Directors.
The following table provides information about purchases by us during the quarter ended August 31, 2015 of
equity securities that are registered by us pursuant to Section 12 of the Exchange Act. Subject to applicable law,
share purchases may be made in open market transactions, privately negotiated transactions, or pursuant to
instruments and plans complying with Rule 10b5-1, among other types of transactions and arrangements.
Issuer Purchases of Equity Securities
Period
Total
Number of
Shares
Purchased
Average
Price Paid
per Share
Total Number of Shares
Purchased as Part of Publicly
Announced Repurchase
Programs(1)
Approximate Dollar Value of
Shares That May Yet be
Purchased Under the Plans or
Program(1)
6/1/15 – 6/30/15 — $ — — $2,668,592,799
7/1/15 – 7/31/15 1,122,731 95.72 1,122,731 2,561,121,823
8/1/15 – 8/31/15 3,033,429 94.65 3,033,429 2,274,004,086
Total 4,156,160 $94.94 4,156,160 $2,274,004,086
(1) In August 2014, our Board of Directors approved the 2014 share repurchase program which authorizes the
purchase of up to $3.0 billion of our common stock prior to its expiration on August 31, 2016.
-34-