Walgreens 2015 Annual Report Download - page 72
Download and view the complete annual report
Please find page 72 of the 2015 Walgreens annual report below. You can navigate through the pages in the report by either clicking on the pages listed below, or by using the keyword search tool below to find specific information within the annual report.-
 1
1 -
2
-
3
-
4
-
5
-
6
-
7
-
8
-
9
-
10
-
11
-
12
-
13
-
14
-
15
-
16
-
17
-
18
-
19
-
20
-
21
-
22
-
23
-
24
-
25
-
26
-
27
-
28
-
29
-
30
-
31
-
32
-
33
-
34
-
35
-
36
-
37
-
38
-
39
-
40
-
41
-
42
-
43
-
44
-
45
-
46
-
47
-
48
-
49
-
50
-
51
-
52
-
53
-
54
-
55
-
56
-
57
-
58
-
59
-
60
-
61
-
 62
62 -
 63
63 -
 64
64 -
 65
65 -
 66
66 -
 67
67 -
 68
68 -
 69
69 -
 70
70 -
 71
71 -
 72
72 -
 73
73 -
 74
74 -
 75
75 -
 76
76 -
 77
77 -
 78
78 -
 79
79 -
 80
80 -
 81
81 -
 82
82 -
83
-
84
-
85
-
86
-
87
-
88
-
89
-
90
-
91
-
92
-
93
-
94
-
95
-
96
-
97
-
98
-
99
-
100
-
101
-
102
-
103
-
104
-
105
-
106
-
107
-
108
-
109
-
110
-
111
-
112
-
113
-
114
-
115
-
116
-
117
-
118
-
119
-
120
-
121
-
122
-
123
-
124
-
125
-
126
-
127
-
128
-
129
-
130
-
131
-
132
-
133
-
134
-
135
-
136
-
137
-
138
-
139
-
140
-
141
-
142
-
143
-
144
-
145
-
146
-
147
-
148
 |
 |

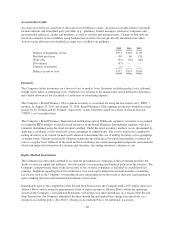
Accounts Receivable
Accounts receivable are stated net of allowances for doubtful accounts. Accounts receivable balances primarily
include amounts due from third party providers (e.g., pharmacy benefit managers, insurance companies and
governmental agencies), clients and members, as well as vendors and manufacturers. Charges to bad debt are
based on estimates of recoverability using both historical write-offs and specifically identified receivables.
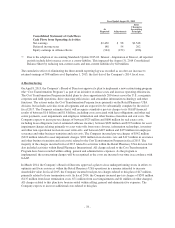
Activity in the allowance for doubtful accounts was as follows (in millions):
2015 2014 2013
Balance at beginning of year $173 $154 $ 99
Bad debt provision 90 86 124
Write-offs (53) (67) (69)
Divestitures (37) — —
Currency translation (1) — —
Balance at end of year $172 $173 $154
Inventory
The Company values inventories on a lower of cost or market basis. Inventory includes product costs, inbound
freight, direct labor, warehousing costs, overhead costs relating to the manufacture and distribution of products
and vendor allowances not classified as a reduction of advertising expense.
The Company’s Retail Pharmacy USA segment inventory is accounted for using the last-in-first-out (“LIFO”)
method. At August 31, 2015 and August 31, 2014, Retail Pharmacy USA segment inventories would have been
greater by $2.5 billion and $2.3 billion, respectively, if they had been valued on a lower of first-in-first-out
(“FIFO”) cost or market basis.
The Company’s Retail Pharmacy International and Pharmaceutical Wholesale segments’ inventory is accounted
for using the FIFO method, except for retail inventory in the Retail Pharmacy International segment, which is
primarily determined using the retail inventory method. Under the retail inventory method, cost is determined by
applying a calculated cost-to-retail ratio across groupings of similar items. The cost-to-retail ratio is applied to
ending inventory at its current owned retail valuation to determine the cost of ending inventory across groupings
of similar items. Current owned retail valuation represents the retail price for which merchandise is offered for
sale on a regular basis. Inherent in the retail method calculation are certain management judgments and estimates
which can impact the owned retail valuation and, therefore, the ending inventory valuation at cost.
Equity Method Investments
The Company uses the equity method to account for investments in companies if the investment provides the
ability to exercise significant influence, but not control, over operating and financial policies of the investee. The
Company’s proportionate share of the net income or loss of these companies is included in consolidated net
earnings. Judgment regarding the level of influence over each equity method investment includes considering
key factors such as the Company’s ownership interest, representation on the board of directors, participation in
policy-making decisions and material intercompany transactions.
Immediately prior to the completion of the Second Step Transaction, the Company held a 45% equity interest in
Alliance Boots and recorded its proportionate share of equity income in Alliance Boots within the operating
section in the Company’s Consolidated Statements of Earnings on a three-month lag. As a result of the Second
Step Transaction, the Company eliminated the three-month lag and applied this change retrospectively as a
change in accounting policy. See Note 3, Change in Accounting Policy for additional discussion.
-68-