Walgreens 2015 Annual Report Download - page 112
Download and view the complete annual report
Please find page 112 of the 2015 Walgreens annual report below. You can navigate through the pages in the report by either clicking on the pages listed below, or by using the keyword search tool below to find specific information within the annual report.-
 1
1 -
2
-
3
-
4
-
5
-
6
-
7
-
8
-
9
-
10
-
11
-
12
-
13
-
14
-
15
-
16
-
17
-
18
-
19
-
20
-
21
-
22
-
23
-
24
-
25
-
26
-
27
-
28
-
29
-
30
-
31
-
32
-
33
-
34
-
35
-
36
-
37
-
38
-
39
-
40
-
41
-
42
-
43
-
44
-
45
-
46
-
47
-
48
-
49
-
50
-
51
-
52
-
53
-
54
-
55
-
56
-
57
-
58
-
59
-
60
-
61
-
62
-
63
-
64
-
65
-
66
-
67
-
68
-
69
-
70
-
71
-
72
-
73
-
74
-
75
-
76
-
77
-
78
-
79
-
80
-
81
-
82
-
83
-
84
-
85
-
86
-
87
-
88
-
89
-
90
-
91
-
92
-
93
-
94
-
95
-
96
-
97
-
98
-
99
-
100
-
101
-
 102
102 -
 103
103 -
 104
104 -
 105
105 -
 106
106 -
 107
107 -
 108
108 -
 109
109 -
 110
110 -
 111
111 -
 112
112 -
 113
113 -
 114
114 -
 115
115 -
 116
116 -
 117
117 -
 118
118 -
 119
119 -
 120
120 -
 121
121 -
 122
122 -
123
-
124
-
125
-
126
-
127
-
128
-
129
-
130
-
131
-
132
-
133
-
134
-
135
-
136
-
137
-
138
-
139
-
140
-
141
-
142
-
143
-
144
-
145
-
146
-
147
-
148
 |
 |

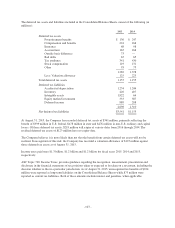
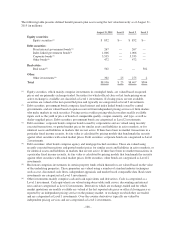
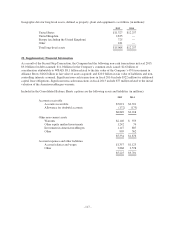
The following table presents defined benefit pension plan assets using the fair value hierarchy as of August 31,
2015 (in millions).
August 31, 2015 Level 1 Level 2 Level 3
Equity securities:
Equity securities(1) $ 852 $— $ 852 $—
Debt securities:
Fixed interest government bonds(2) 267 — 267 —
Index linked government bonds(2) 1,006 — 1,006 —
Corporate bonds(3) 5,535 — 5,535 —
Other bonds(4) 472 — 472 —
Real estate:
Real estate(5) 502 — — 502
Other:
Other investments(6) 302 25 275 2
Total $8,936 $ 25 $8,407 $504
(1) Equity securities, which mainly comprise investments in comingled funds, are valued based on quoted
prices and are primarily exchange-traded. Securities for which official close or last trade pricing on an
active exchange is available are classified as Level 1 investments. If closing prices are not available,
securities are valued at the last quoted bid price and typically are categorized as Level 2 investments.
(2) Debt securities: government bonds comprise fixed interest and index linked bonds issued by central
governments, and are valued based on quotes received from independent pricing services or from dealers
who make markets in such securities. Pricing services utilize pricing which considers readily available
inputs such as the yield or price of bonds of comparable quality, coupon, maturity, and type, as well as
dealer-supplied prices. Debt securities: government bonds are categorized as Level 2 investments.
(3) Debt securities: corporate bonds comprise bonds issued by corporations and are valued using recently
executed transactions, or quoted market prices for similar assets and liabilities in active markets, or for
identical assets and liabilities in markets that are not active. If there have been no market transactions in a
particular fixed income security, its fair value is calculated by pricing models that benchmark the security
against other securities with actual market prices. Debt securities: corporate bonds are categorized as Level
2 investments.
(4) Debt securities: other bonds comprise agency and mortgage-backed securities. These are valued using
recently executed transactions and quoted market prices for similar assets and liabilities in active markets, or
for identical assets and liabilities in markets that are not active. If there have been no market transactions in
a particular fixed income security, its fair value is calculated by pricing models that benchmark the security
against other securities with actual market prices. Debt securities: other bonds are categorized as Level 2
investments.
(5) Real estate comprises investments in certain property funds which themselves are valued based on the value
of the underlying properties. These properties are valued using a number of standard industry techniques
such as cost, discounted cash flows, independent appraisals and market based comparable data. Real estate
investments are categorized as Level 3 investments.
(6) Other investments mainly comprise cash and cash equivalents and derivatives. Cash is categorized as a
Level 1 investment. Cash equivalents are valued using observable yield curves, discounting and interest
rates and are categorized as Level 2 investments. Derivatives which are exchange-traded and for which
market quotations are readily available are valued at the last reported sale price or official closing price as
reported by an independent pricing service on the primary market, or exchange on which they are traded,
and are categorized as Level 1 investments. Over-the-counter derivatives typically are valued by
independent pricing services and are categorized as Level 2 investments.
- 108 -