Walgreens 2015 Annual Report Download - page 44
Download and view the complete annual report
Please find page 44 of the 2015 Walgreens annual report below. You can navigate through the pages in the report by either clicking on the pages listed below, or by using the keyword search tool below to find specific information within the annual report.-
 1
1 -
2
-
3
-
4
-
5
-
6
-
7
-
8
-
9
-
10
-
11
-
12
-
13
-
14
-
15
-
16
-
17
-
18
-
19
-
20
-
21
-
22
-
23
-
24
-
25
-
26
-
27
-
28
-
29
-
30
-
31
-
32
-
33
-
 34
34 -
 35
35 -
 36
36 -
 37
37 -
 38
38 -
 39
39 -
 40
40 -
 41
41 -
 42
42 -
 43
43 -
 44
44 -
 45
45 -
 46
46 -
 47
47 -
 48
48 -
 49
49 -
 50
50 -
 51
51 -
 52
52 -
 53
53 -
 54
54 -
55
-
56
-
57
-
58
-
59
-
60
-
61
-
62
-
63
-
64
-
65
-
66
-
67
-
68
-
69
-
70
-
71
-
72
-
73
-
74
-
75
-
76
-
77
-
78
-
79
-
80
-
81
-
82
-
83
-
84
-
85
-
86
-
87
-
88
-
89
-
90
-
91
-
92
-
93
-
94
-
95
-
96
-
97
-
98
-
99
-
100
-
101
-
102
-
103
-
104
-
105
-
106
-
107
-
108
-
109
-
110
-
111
-
112
-
113
-
114
-
115
-
116
-
117
-
118
-
119
-
120
-
121
-
122
-
123
-
124
-
125
-
126
-
127
-
128
-
129
-
130
-
131
-
132
-
133
-
134
-
135
-
136
-
137
-
138
-
139
-
140
-
141
-
142
-
143
-
144
-
145
-
146
-
147
-
148
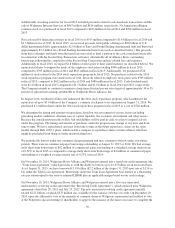
 |
 |

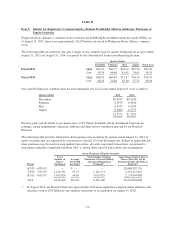
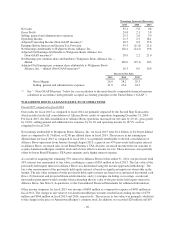
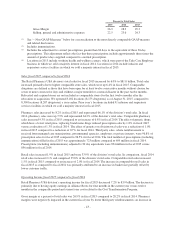
Percentage Increases/(Decreases)
2015 2014 2013
Net sales 35.4 5.8 0.8
Gross Profit 24.8 2.1 3.8
Selling, general and administrative expenses 25.5 2.6 3.9
Operating Income 11.3 2.5 18.1
Adjusted Operating Income (Non-GAAP measure)(1) 26.5 0.8 17.8
Earnings Before Interest and Income Tax Provision 59.3 (11.8) 21.6
Net Earnings Attributable to Walgreens Boots Alliance, Inc. 118.4 (24.2) 19.8
Adjusted Net Earnings Attributable to Walgreens Boots Alliance, Inc.
(Non-GAAP measure)(1) 28.9 2.2 21.0
Net Earnings per common share attributable to Walgreens Boots Alliance, Inc. –
diluted 100.0 (25.1) 10.3
Adjusted Net Earnings per common share attributable to Walgreens Boots
Alliance, Inc. – diluted (Non-GAAP measure)(1) 18.3 0.9 10.9
Percent to Net Sales
2015 2014 2013
Gross Margin 26.0 28.2 29.3
Selling, general and administrative expenses 21.8 23.6 24.3
(1) See “– Non-GAAP Measures” below for a reconciliation to the most directly comparable financial measure
calculated in accordance with generally accepted accounting principles in the United States (“GAAP”).
WALGREENS BOOTS ALLIANCE RESULTS OF OPERATIONS
Fiscal 2015 compared to fiscal 2014
Our results for fiscal 2015 as compared to fiscal 2014 are primarily impacted by the Second Step Transaction
which resulted in the full consolidation of Alliance Boots results of operations beginning December 31, 2014.
For fiscal 2015, the full consolidation of Alliance Boots operations increased our net sales by 29.4%, gross profit
by 23.6%, selling general and administrative expenses by 24.1% and operating income by 18.5%, each as
compared to fiscal 2014.
Net earnings attributable to Walgreens Boots Alliance, Inc. for fiscal 2015 were $4.2 billion, or $4.00 per diluted
share as compared to $1.9 billion, or $2.00 per diluted share in fiscal 2014. The increase in net earnings per
diluted share for fiscal 2015 as compared to fiscal 2014, was primarily attributable to the full consolidation of
Alliance Boots operations from January through August 2015, a gain on our 45% previously held equity interest
in Alliance Boots, increased sales in our Retail Pharmacy USA division, increased income from our warrants to
acquire AmerisourceBergen common stock and a lower effective income tax rate. These increases were partially
offset by lower Retail Pharmacy USA gross margins and a higher interest expense.
As a result of acquiring the remaining 55% interest in Alliance Boots on December 31, 2014, our previously held
45% interest was remeasured to fair value, resulting in a gain of $563 million in fiscal 2015. The fair value of the
previously held equity interest in Alliance Boots was determined using the income approach methodology. The
fair value measurement of the previously held equity interest is based on significant inputs not observable in the
market. The fair value estimates for the previously held equity interest are based on (a) projected discounted cash
flows, (b) historical and projected financial information, and (c) synergies including cost savings, as relevant,
that market participants would consider when estimating the fair value of the previously held equity interest in
Alliance Boots. See Note 8, Acquisitions, to the Consolidated Financial Statements for additional information.
Other income (expense) for fiscal 2015 was income of $685 million as compared to expense of $481 million in
fiscal 2014. The change in fair value of our AmerisourceBergen warrants resulted in recording income of $759
million and $366 million in fiscal 2015 and 2014, respectively. The increase in fair value was primarily attributed
to the change in the price of AmerisourceBergen’s common stock. In addition, we recorded $20 million and $19
-40-