Walgreens 2015 Annual Report Download - page 52
Download and view the complete annual report
Please find page 52 of the 2015 Walgreens annual report below. You can navigate through the pages in the report by either clicking on the pages listed below, or by using the keyword search tool below to find specific information within the annual report.-
 1
1 -
2
-
3
-
4
-
5
-
6
-
7
-
8
-
9
-
10
-
11
-
12
-
13
-
14
-
15
-
16
-
17
-
18
-
19
-
20
-
21
-
22
-
23
-
24
-
25
-
26
-
27
-
28
-
29
-
30
-
31
-
32
-
33
-
34
-
35
-
36
-
37
-
38
-
39
-
40
-
41
-
 42
42 -
 43
43 -
 44
44 -
 45
45 -
 46
46 -
 47
47 -
 48
48 -
 49
49 -
 50
50 -
 51
51 -
 52
52 -
 53
53 -
 54
54 -
 55
55 -
 56
56 -
 57
57 -
 58
58 -
 59
59 -
 60
60 -
 61
61 -
 62
62 -
63
-
64
-
65
-
66
-
67
-
68
-
69
-
70
-
71
-
72
-
73
-
74
-
75
-
76
-
77
-
78
-
79
-
80
-
81
-
82
-
83
-
84
-
85
-
86
-
87
-
88
-
89
-
90
-
91
-
92
-
93
-
94
-
95
-
96
-
97
-
98
-
99
-
100
-
101
-
102
-
103
-
104
-
105
-
106
-
107
-
108
-
109
-
110
-
111
-
112
-
113
-
114
-
115
-
116
-
117
-
118
-
119
-
120
-
121
-
122
-
123
-
124
-
125
-
126
-
127
-
128
-
129
-
130
-
131
-
132
-
133
-
134
-
135
-
136
-
137
-
138
-
139
-
140
-
141
-
142
-
143
-
144
-
145
-
146
-
147
-
148
 |
 |

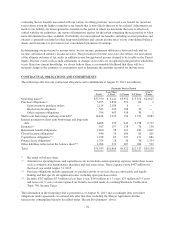
2015 2014 2013
Net earnings attributable to Walgreens Boots Alliance, Inc. (GAAP) $4,220 $1,932 $2,548
Alliance Boots call option loss — 866 —
Acquisition-related amortization 367 238 255
Cost transformation 338 — —
LIFO provision 178 86 151
Transaction foreign currency hedging loss 166 — —
Asset impairment 69 — —
Alliance Boots equity method non-cash tax 71 180 152
Early debt extinguishment 62 — —
Acquisition-related costs 54 54 60
Store closures and other optimization costs 35 179 —
Prefunded interest expense 26 — —
Loss (gain) on sale of business 11 (6) (13)
Gain on previously held equity interest (671) — —
Increase in fair market value of warrants (567) (359) (129)
Release of capital loss valuation allowance (220) — —
Net investment hedging gain (54) — —
DEA settlement costs — — 47
Hurricane Sandy costs — — 24
Distributor transition costs — — 8
Adjusted net earnings attributable to Walgreens Boots Alliance, Inc.
(Non-GAAP measure) $4,085 $3,170 $3,103
2015 2014 2013
Net earnings per common share attributable to Walgreens Boots Alliance, Inc. –
diluted (GAAP) $ 4.00 $ 2.00 $ 2.67
Alliance Boots call option loss — 0.90 —
Acquisition-related amortization 0.35 0.25 0.26
Cost transformation 0.32 — —
LIFO provision 0.17 0.09 0.16
Transaction foreign currency hedging loss 0.16 — —
Asset impairment 0.07 — —
Alliance Boots equity method non-cash tax 0.07 0.18 0.16
Early debt extinguishment 0.06 — —
Acquisition-related costs 0.05 0.06 0.06
Store closures and other optimization costs 0.03 0.18 —
Prefunded interest expense 0.03 — —
Loss (gain) on sale of business 0.01 (0.01) (0.01)
Gain on previously held equity interest (0.64) — —
Increase in fair market value of warrants (0.54) (0.37) (0.14)
Release of capital loss valuation allowance (0.21) — —
Net investment hedging gain (0.05) — —
DEA settlement costs — — 0.05
Hurricane Sandy costs — — 0.03
Distributor transition costs — — 0.01
Adjusted net earnings per common share attributable to Walgreens Boots
Alliance, Inc. – diluted (Non-GAAP measure) $ 3.88 $ 3.28 $ 3.25
-48-