US Cellular 2014 Annual Report Download - page 67
Download and view the complete annual report
Please find page 67 of the 2014 US Cellular annual report below. You can navigate through the pages in the report by either clicking on the pages listed below, or by using the keyword search tool below to find specific information within the annual report.
United States Cellular Corporation
Notes to Consolidated Financial Statements (Continued)
NOTE 8 INVESTMENTS IN UNCONSOLIDATED ENTITIES (Continued)
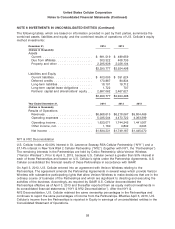
In accordance with GAAP, as a result of the NY1 & NY2 Deconsolidation, U.S. Cellular’s interest in the
Partnerships was reflected in Investments in unconsolidated entities at a fair value of $114.8 million as of
April 3, 2013. Recording U.S. Cellular’s interest in the Partnerships required allocation of the excess of
fair value over book value to customer lists, licenses, a favorable contract and goodwill of the
Partnerships. Amortization expense related to customer lists and the favorable contract will be recognized
over their respective useful lives and is included in Equity in earnings of unconsolidated entities in the
Consolidated Statement of Operations. In addition, U.S. Cellular recognized a non-cash pre-tax gain of
$18.5 million in the second quarter of 2013. The gain was recorded in Gain (loss) on investments in the
Consolidated Statement of Operations.
The Partnerships were valued using a discounted cash flow approach and a guideline public company
method. The discounted cash flow approach uses value drivers and risks specific to the industry and
current economic factors and incorporates assumptions that market participants would use in their
estimates of fair value and may not be indicative of U.S. Cellular specific assumptions. The most
significant assumptions made in this process were the revenue growth rate (shown as a simple average
in the table below), the terminal revenue growth rate, discount rate and capital expenditures. The
assumptions were as follows:
Key assumptions
Average expected revenue growth rate (next ten years) .............. 2.0%
Terminal revenue growth rate (after year ten) ...................... 2.0%
Discount rate ............................................. 10.5%
Capital expenditures as a percentage of revenue ................... 14.9 - 18.8%
The guideline public company method develops an indication of fair value by calculating average market
pricing multiples for selected publicly-traded companies. The developed multiples were applied to
applicable financial measures of the Partnerships to determine fair value. The discounted cash flow
approach and guideline public company method were weighted to arrive at the total fair value of the
Partnerships.
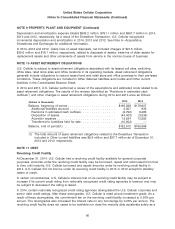
NOTE 9 PROPERTY, PLANT AND EQUIPMENT
Property, plant and equipment in service and under construction, and related accumulated depreciation
and amortization, as of December 31, 2014 and 2013 were as follows:
Useful Lives
December 31, (Years) 2014 2013
(Dollars in thousands)
Land .............................. N/A $ 35,031 $ 36,266
Buildings ........................... 20 296,502 304,272
Leasehold and land improvements ......... 1-30 1,086,718 1,197,520
Cell site equipment .................... 7-25 3,269,609 3,306,575
Switching equipment .................. 5-8 960,377 1,161,976
Office furniture and equipment ............ 3-5 553,630 539,248
Other operating assets and equipment ...... 3-5 89,663 92,456
System development .................. 1-7 1,042,195 962,698
Work in process ...................... N/A 125,015 116,501
7,458,740 7,717,512
Accumulated depreciation and amortization . . (4,730,523) (4,860,992)
$ 2,728,217 $ 2,856,520
59


