US Cellular 2014 Annual Report Download - page 10
Download and view the complete annual report
Please find page 10 of the 2014 US Cellular annual report below. You can navigate through the pages in the report by either clicking on the pages listed below, or by using the keyword search tool below to find specific information within the annual report.-
 1
1 -
 2
2 -
 3
3 -
 4
4 -
 5
5 -
 6
6 -
 7
7 -
 8
8 -
 9
9 -
 10
10 -
 11
11 -
 12
12 -
 13
13 -
 14
14 -
 15
15 -
 16
16 -
 17
17 -
 18
18 -
 19
19 -
 20
20 -
 21
21 -
22
-
23
-
24
-
25
-
26
-
27
-
28
-
29
-
30
-
31
-
32
-
33
-
34
-
35
-
36
-
37
-
38
-
39
-
40
-
41
-
42
-
43
-
44
-
45
-
46
-
47
-
48
-
49
-
50
-
51
-
52
-
53
-
54
-
55
-
56
-
57
-
58
-
59
-
60
-
61
-
62
-
63
-
64
-
65
-
66
-
67
-
68
-
69
-
70
-
71
-
72
-
73
-
74
-
75
-
76
-
77
-
78
-
79
-
80
-
81
-
82
-
83
-
84
-
85
-
86
-
87
-
88
-
89
-
90
-
91
-
92
 |
 |
United States Cellular Corporation
Management’s Discussion and Analysis of Financial Condition and Results of Operations
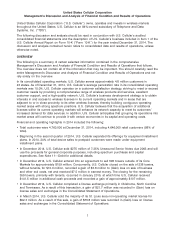
• In February 2014, U.S. Cellular completed a license exchange in Wisconsin. As a result of this
transaction, a gain of $15.7 million was recorded in (Gain) loss on license sales and exchanges in the
Consolidated Statement of Operations.
In 2014, Core Markets information is the same as Consolidated Markets information. However, because
the Divestiture Transaction and the NY1 & NY2 Deconsolidation were consummated in the second
quarter of 2013, the Consolidated Markets in the first six months of 2013 include information with respect
to the Divestiture Markets and the NY1 & NY2 Partnerships. Accordingly, the following operating
information is presented for Core Markets to permit a comparison of 2014 to 2013 excluding the
Divestiture Markets and the NY1 & NY2 Partnerships. As used here, Core Markets is defined as all
consolidated markets in which U.S. Cellular currently conducts business and, therefore, excludes the
Divestiture Markets and the NY1 & NY2 Partnerships. Core Markets as defined also includes any other
income or expenses due to U.S. Cellular’s direct or indirect ownership interests in other spectrum in the
Divestiture Markets which was not included in the Divestiture Transaction and other retained assets from
the Divestiture Markets. See Note 6—Acquisitions, Divestitures and Exchanges and Note 8—Investments
in Unconsolidated Entities in the Notes to Consolidated Financial Statements for additional information.
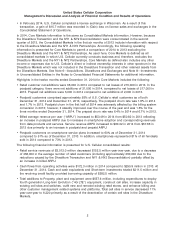
Highlights in the twelve months ended December 31, 2014 for Core Markets included the following:
• Retail customer net additions were 36,000 in 2014 compared to net losses of 215,000 in 2013. In the
postpaid category, there were net additions of 31,000 in 2014, compared to net losses of 217,000 in
2013. Prepaid net additions were 5,000 in 2014 compared to net additions of 2,000 in 2013.
• Postpaid customers comprised approximately 93% of U.S. Cellular’s retail customers as of both
December 31, 2014 and December 31, 2013, respectively. The postpaid churn rate was 1.8% in 2014
and 1.7% in 2013. Postpaid churn in the first half of 2014 was adversely affected by the billing system
conversion in 2013; however, it steadily improved over the course of the year and was 1.6% for the
three months ended December 31, 2014. The prepaid churn rate was 6.4% in 2014 and 6.7% in 2013.
• Billed average revenue per user (‘‘ARPU’’) increased to $53.49 in 2014 from $50.82 in 2013 reflecting
an increase in postpaid ARPU due to increases in smartphone adoption and corresponding revenues
from data products and services. Service revenue ARPU increased to $60.32 in 2014 from $57.66 in
2013 due primarily to an increase in postpaid and prepaid ARPU.
• Postpaid customers on smartphone service plans increased to 60% as of December 31, 2014
compared to 51% as of December 31, 2013. In addition, smartphones represented 81% of all handsets
sold in 2014 compared to 73% in 2013.
The following financial information is presented for U.S. Cellular consolidated results:
• Retail service revenues of $3,013.0 million decreased $152.5 million year-over-year, due to a decrease
of 456,000 in the average number of retail customers (including approximately 250,000 due to the
reductions caused by the Divestiture Transaction and NY1 & NY2 Deconsolidation) partially offset by
an increase in billed ARPU.
• Cash flows from operating activities were $172.3 million in 2014 compared to $290.9 million in 2013. At
December 31, 2014, Cash and cash equivalents and Short-term investments totaled $211.5 million and
the revolving credit facility provided borrowing capacity of $282.5 million.
• Total additions to Property, plant and equipment were $557.6 million, including expenditures to deploy
fourth generation Long-term Evolution (‘‘4G LTE’’) equipment, construct cell sites, increase capacity in
existing cell sites and switches, outfit new and remodel existing retail stores, and enhance billing and
other customer management related systems and platforms. Total cell sites in service decreased 11%
year-over-year to 6,220 primarily as a result of the deactivation of certain cell sites in the Divestiture
Markets.
2