US Cellular 2014 Annual Report Download - page 4
Download and view the complete annual report
Please find page 4 of the 2014 US Cellular annual report below. You can navigate through the pages in the report by either clicking on the pages listed below, or by using the keyword search tool below to find specific information within the annual report.-
 1
1 -
 2
2 -
 3
3 -
 4
4 -
 5
5 -
 6
6 -
 7
7 -
 8
8 -
 9
9 -
 10
10 -
 11
11 -
 12
12 -
 13
13 -
 14
14 -
 15
15 -
16
-
17
-
18
-
19
-
20
-
21
-
22
-
23
-
24
-
25
-
26
-
27
-
28
-
29
-
30
-
31
-
32
-
33
-
34
-
35
-
36
-
37
-
38
-
39
-
40
-
41
-
42
-
43
-
44
-
45
-
46
-
47
-
48
-
49
-
50
-
51
-
52
-
53
-
54
-
55
-
56
-
57
-
58
-
59
-
60
-
61
-
62
-
63
-
64
-
65
-
66
-
67
-
68
-
69
-
70
-
71
-
72
-
73
-
74
-
75
-
76
-
77
-
78
-
79
-
80
-
81
-
82
-
83
-
84
-
85
-
86
-
87
-
88
-
89
-
90
-
91
-
92
 |
 |

2 U.S. CELLULAR
choose from a competitive portfolio of the
products they want, including Samsung, Apple,
Motorola, and LG smartphones and connected
devices. Our attractive plans and pricing seal the
deal.
Also in 2014, we expanded our retail distribution
network. In addition to our own U.S. Cellular stores,
customers can purchase our plans and products
when they are at select Wal-Mart, Sam’s Club, and
Dollar General retail locations, as well as on
Amazon.com.
Driving Revenue Growth and Profi ts
The return to customer growth enabled us to
deliver improved revenue growth over the second
through new plans and smartphone and
connected device penetration, our average
revenue per account (ARPA) increased by 10% to
higher subsidies associated with selling more
4G LTE devices, including Apple products.
Under our Shared Connect plans, for which 47% of
postpaid customers are now signed up, we are
moving aggressively to monetize the explosive
growth in data usage. As we focus increasingly on
selling shared plans with larger data buckets, the
important. Smartphone customers were 60% of
postpaid customers at the end of 2014, and
smartphones represented 81% of total handsets
sold for the year. Connected devices were 7% of
total devices sold for the year, helping to drive
growth in data usage.
In 2014, we began to reap the
we initiated in prior years.
In 2014, we began to reap the In 2014, we began to reap the
we initiated in prior years. we initiated in prior years.
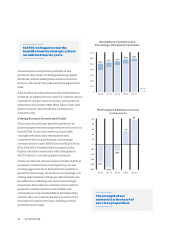
Smartphone Customers as a
Percentage of Postpaid Customers
Net Postpaid Additions (Losses)
(in thousands)
The strength of our
network is at the heart of
our value proposition.
The strength of our The strength of our
network is at the heart of network is at the heart of
our value proposition.our value proposition.
100
80
60
40
20
0
(20)
(40)
(60)
(80)
(100)
(71)
(93)
(26)
52
98
Q4 13 Q1 14 Q2 14 Q3 14 Q4 14
Q4 13 Q1 14 Q2 14 Q3 14 Q4 14
70%
60%
50%
40%
30%
20%
10%
0
51% 53% 55%
58%
4G
3G
60%