US Cellular 2014 Annual Report Download - page 21
Download and view the complete annual report
Please find page 21 of the 2014 US Cellular annual report below. You can navigate through the pages in the report by either clicking on the pages listed below, or by using the keyword search tool below to find specific information within the annual report.-
 1
1 -
2
-
3
-
4
-
5
-
6
-
7
-
8
-
9
-
10
-
 11
11 -
 12
12 -
 13
13 -
 14
14 -
 15
15 -
 16
16 -
 17
17 -
 18
18 -
 19
19 -
 20
20 -
 21
21 -
 22
22 -
 23
23 -
 24
24 -
 25
25 -
 26
26 -
 27
27 -
 28
28 -
 29
29 -
 30
30 -
 31
31 -
32
-
33
-
34
-
35
-
36
-
37
-
38
-
39
-
40
-
41
-
42
-
43
-
44
-
45
-
46
-
47
-
48
-
49
-
50
-
51
-
52
-
53
-
54
-
55
-
56
-
57
-
58
-
59
-
60
-
61
-
62
-
63
-
64
-
65
-
66
-
67
-
68
-
69
-
70
-
71
-
72
-
73
-
74
-
75
-
76
-
77
-
78
-
79
-
80
-
81
-
82
-
83
-
84
-
85
-
86
-
87
-
88
-
89
-
90
-
91
-
92
 |
 |

United States Cellular Corporation
Management’s Discussion and Analysis of Financial Condition and Results of Operations
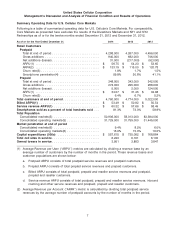
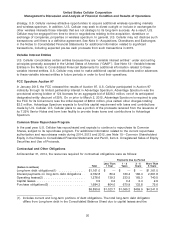
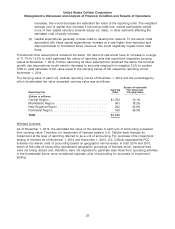
Components of Other Income (Expense)
Increase/ Percentage Increase/ Percentage
Year Ended December 31, 2014 (Decrease) Change 2013 (Decrease) Change 2012
(Dollars in thousands)
Operating income (loss) ....... $(143,390) $(290,255) >(100)% $146,865 $ (9,791) (6)% $156,656
Equity in earnings of
unconsolidated entities ...... 129,764 (2,185) (2)% 131,949 41,585 46% 90,364
Interest and dividend income . . . 12,148 8,187 >100% 3,961 317 9% 3,644
Gain (loss) on investments ..... — (18,556) N/M 18,556 22,274 >100% (3,718)
Interest expense ............ (57,386) 13,423 31% (43,963) 1,570 4% (42,393)
Other, net ................. 160 (128) (44)% 288 (212) (42)% 500
Total investment and other
income ................. 84,686 (26,105) (24)% 110,791 62,394 >100% 48,397
Income (loss) before income
taxes .................. (58,704) (316,360) >(100)% 257,656 52,603 26% 205,053
Income tax expense (benefit) . . . (11,782) (124,916) >(100)% 113,134 49,157 77% 63,977
Net income (loss) ........... (46,922) (191,444) >(100)% 144,522 3,446 2% 141,076
Less: Net income (loss)
attributable to noncontrolling
interests, net of tax ......... (4,110) (8,594) >(100)% 4,484 (25,586) (85)% 30,070
Net income (loss) attributable to
U.S. Cellular shareholders . . . . $ (42,812) $(182,850) >(100)% $140,038 $ 29,032 26% $111,006
Equity in earnings of unconsolidated entities
Equity in earnings of unconsolidated entities represents U.S. Cellular’s share of net income from entities
in which it has a noncontrolling interest and that are accounted for by the equity method.
U.S. Cellular’s investment in the Los Angeles SMSA Limited Partnership (‘‘LA Partnership’’) contributed
$71.8 million, $78.4 million and $67.2 million to Equity in earnings of unconsolidated entities in 2014,
2013 and 2012, respectively.
On April 3, 2013, U.S. Cellular deconsolidated the NY1 & NY2 Partnerships and began reporting them as
equity method investments in its consolidated financial statements as of that date. Equity in earnings of
the NY1 & NY2 Partnerships was $29.0 million and $24.7 million in 2014 and 2013, respectively. See
Note 8—Investments in Unconsolidated Entities in the Notes to Consolidated Financial Statements for
additional information.
Interest and dividend income
In 2014, Interest and dividend income increased by $8.2 million due primarily to imputed interest income
recognized on equipment installment plans. See Note 3—Equipment Installment Plans in the Notes to
Consolidated Financial Statements for additional information.
Gain (loss) on investments
In 2013, in connection with the deconsolidation of the NY1 & NY2 Partnerships, U.S. Cellular recognized
a non-cash pre-tax gain of $18.5 million.
Interest expense
In 2014, interest expense increased by $13.4 million from 2013 due primarily to a decrease in capitalized
interest related to network and systems projects. Interest cost capitalized was $6.2 million and
$18.4 million for 2014 and 2013, respectively. Interest expense in 2013 as compared to 2012 was
relatively flat.
13