US Cellular 2014 Annual Report Download - page 31
Download and view the complete annual report
Please find page 31 of the 2014 US Cellular annual report below. You can navigate through the pages in the report by either clicking on the pages listed below, or by using the keyword search tool below to find specific information within the annual report.-
 1
1 -
2
-
3
-
4
-
5
-
6
-
7
-
8
-
9
-
10
-
11
-
12
-
13
-
14
-
15
-
16
-
17
-
18
-
19
-
20
-
 21
21 -
 22
22 -
 23
23 -
 24
24 -
 25
25 -
 26
26 -
 27
27 -
 28
28 -
 29
29 -
 30
30 -
 31
31 -
 32
32 -
 33
33 -
 34
34 -
 35
35 -
 36
36 -
 37
37 -
 38
38 -
 39
39 -
 40
40 -
 41
41 -
42
-
43
-
44
-
45
-
46
-
47
-
48
-
49
-
50
-
51
-
52
-
53
-
54
-
55
-
56
-
57
-
58
-
59
-
60
-
61
-
62
-
63
-
64
-
65
-
66
-
67
-
68
-
69
-
70
-
71
-
72
-
73
-
74
-
75
-
76
-
77
-
78
-
79
-
80
-
81
-
82
-
83
-
84
-
85
-
86
-
87
-
88
-
89
-
90
-
91
-
92
 |
 |

United States Cellular Corporation
Management’s Discussion and Analysis of Financial Condition and Results of Operations
increases, this would decrease the estimated fair value of the reporting units. The weighted
average cost of capital may increase if borrowing costs rise, market participants weight
more of their capital structure towards equity (vs. debt), or other elements affecting the
estimated cost of equity increase.
(3) Capital expenditures generally include costs to develop the network. To the extent costs
associated with these capital expenditures increase at a rate higher than expected and
disproportionate to forecasted future revenues, this could negatively impact future cash
flows.
Provided all other assumptions remained the same, the discount rate would have to increase to a range
of 11.1% to 12.5% to yield estimated fair values of reporting units that equal their respective carrying
values at November 1, 2014. Further, assuming all other assumptions remained the same, the terminal
growth rate assumptions would need to decrease to amounts ranging from negative 3.2% to positive
0.6% to yield estimates of fair value equal to the carrying values of the respective reporting unit at
November 1, 2014.
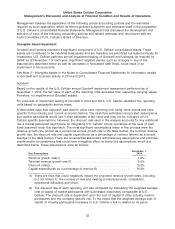
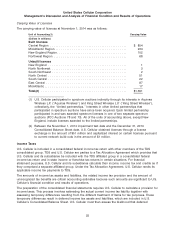
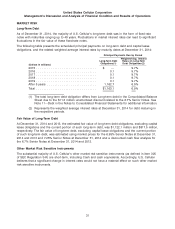
The carrying value of each U.S. Cellular reporting unit as of November 1, 2014 and the percentage by
which its estimated fair value exceeded carrying value was as follows:
Excess of estimated
Carrying Fair Value over
Reporting Unit Value Carrying Value
(Dollars in millions)
Central Region ................................ $1,793 10.1%
Mid-Atlantic Region ............................ 491 18.2%
New England Region ........................... 202 30.0%
Northwest Region ............................. 160 36.3%
Total ....................................... $2,646
Wireless Licenses
As of November 1, 2014, the estimated fair value of the licenses in each unit of accounting exceeded
their carrying value. Therefore, no impairment of licenses existed. U.S. Cellular tests licenses for
impairment at the level of reporting referred to as a unit of accounting. For purposes of its impairment
testing of licenses as of November 1, 2014 and November 1, 2013, U.S. Cellular separated its FCC
licenses into eleven units of accounting based on geographic service areas. In both 2014 and 2013,
seven of the units of accounting represented geographic groupings of licenses which, because they
were not being utilized and, therefore, were not expected to generate cash flows from operating activities
in the foreseeable future, were considered separate units of accounting for purposes of impairment
testing.
23