US Cellular 2014 Annual Report Download - page 20
Download and view the complete annual report
Please find page 20 of the 2014 US Cellular annual report below. You can navigate through the pages in the report by either clicking on the pages listed below, or by using the keyword search tool below to find specific information within the annual report.-
 1
1 -
2
-
3
-
4
-
5
-
6
-
7
-
8
-
9
-
 10
10 -
 11
11 -
 12
12 -
 13
13 -
 14
14 -
 15
15 -
 16
16 -
 17
17 -
 18
18 -
 19
19 -
 20
20 -
 21
21 -
 22
22 -
 23
23 -
 24
24 -
 25
25 -
 26
26 -
 27
27 -
 28
28 -
 29
29 -
 30
30 -
31
-
32
-
33
-
34
-
35
-
36
-
37
-
38
-
39
-
40
-
41
-
42
-
43
-
44
-
45
-
46
-
47
-
48
-
49
-
50
-
51
-
52
-
53
-
54
-
55
-
56
-
57
-
58
-
59
-
60
-
61
-
62
-
63
-
64
-
65
-
66
-
67
-
68
-
69
-
70
-
71
-
72
-
73
-
74
-
75
-
76
-
77
-
78
-
79
-
80
-
81
-
82
-
83
-
84
-
85
-
86
-
87
-
88
-
89
-
90
-
91
-
92
 |
 |
United States Cellular Corporation
Management’s Discussion and Analysis of Financial Condition and Results of Operations
related expenses; corporate marketing and merchandise management; and advertising expenses.
Selling, general and administrative expenses also include bad debts expense, costs of operating
customer care centers and corporate expenses.
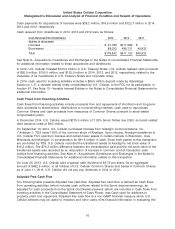
Selling, general and administrative expenses decreased by $85.5 million to $1,591.9 million in 2014 and
by $87.5 million to $1,677.4 million in 2013. Key components of the net changes in Selling, general and
administrative expenses were as follows:
2014—
• General and administrative expenses decreased by $79.7 million, or 8%, due primarily to the
Divestiture Transaction and NY1 & NY2 Deconsolidation and lower consulting expenses related to the
billing system conversion in the prior year.
• Selling and marketing expenses decreased by $5.7 million, or 1%, due primarily to lower agent,
employee and facilities costs as a result of the Divestiture Transaction, partially offset by increases in
advertising expense and commissions; higher commissions reflected increases in gross additions,
renewals and accessory sales volumes.
2013—
• Selling and marketing expenses decreased by $75.7 million, or 9%, primarily from lower commission
expenses, more cost-effective advertising spending and reduced employee and facilities costs as a
result of the Divestiture Transaction.
• General and administrative expenses decreased by $11.8 million, or 1%, driven by corporate cost
containment and reduction initiatives and reduced spending as a result of the Divestiture Transaction,
offset by costs associated with launching the new billing system of $55.8 million and higher bad debts
expense of $31.5 million due to higher customer accounts receivable balances resulting from billing
issues experienced after the system conversion.
Depreciation, amortization and accretion
Depreciation, amortization and accretion expense decreased $197.8 million, or 25%, in 2014, due
primarily to the higher amount of accelerated depreciation, amortization and accretion in the Divestiture
Markets that occurred in 2013. Depreciation, amortization and accretion expense increased
$195.1 million, or 32%, in 2013 due primarily to the acceleration of depreciation, amortization and
accretion in the Divestiture Markets. The impact of the acceleration was $13.1 million and $158.5 million
in 2014 and 2013, respectively. The accelerated depreciation, amortization and accretion in the
Divestiture Markets was completed in the first quarter of 2014.
(Gain) loss on asset disposals, net
(Gain) loss on asset disposals, net was a loss of $21.5 million in 2014 and $30.6 million in 2013 due
primarily to losses resulting from the write-off and disposals of certain network assets.
(Gain) loss on sale of business and other exit costs, net
(Gain) loss on sale of business and other exit costs, net was a gain of $32.8 million in 2014 and
$246.8 million in 2013, both primarily related to the Divestiture Transaction. See Note 6—Acquisitions,
Divestitures and Exchanges in the Notes to Consolidated Financial Statements for additional information.
(Gain) loss on license sales and exchanges
(Gain) loss on license sales and exchanges was a net gain in 2014 resulting from the sale of the
St. Louis area non-operating market license and the license exchanges primarily in Wisconsin,
Oklahoma, North Carolina and Tennessee. The gain in 2013 resulted from the sale of the Mississippi
Valley non-operating market license for $308.0 million, which resulted in a pre-tax gain of $250.6 million.
See Note 6—Acquisitions, Divestitures and Exchanges in the Notes to Consolidated Financial Statements
for additional information.
12