US Cellular 2014 Annual Report Download - page 32
Download and view the complete annual report
Please find page 32 of the 2014 US Cellular annual report below. You can navigate through the pages in the report by either clicking on the pages listed below, or by using the keyword search tool below to find specific information within the annual report.-
 1
1 -
2
-
3
-
4
-
5
-
6
-
7
-
8
-
9
-
10
-
11
-
12
-
13
-
14
-
15
-
16
-
17
-
18
-
19
-
20
-
21
-
 22
22 -
 23
23 -
 24
24 -
 25
25 -
 26
26 -
 27
27 -
 28
28 -
 29
29 -
 30
30 -
 31
31 -
 32
32 -
 33
33 -
 34
34 -
 35
35 -
 36
36 -
 37
37 -
 38
38 -
 39
39 -
 40
40 -
 41
41 -
 42
42 -
43
-
44
-
45
-
46
-
47
-
48
-
49
-
50
-
51
-
52
-
53
-
54
-
55
-
56
-
57
-
58
-
59
-
60
-
61
-
62
-
63
-
64
-
65
-
66
-
67
-
68
-
69
-
70
-
71
-
72
-
73
-
74
-
75
-
76
-
77
-
78
-
79
-
80
-
81
-
82
-
83
-
84
-
85
-
86
-
87
-
88
-
89
-
90
-
91
-
92
 |
 |

United States Cellular Corporation
Management’s Discussion and Analysis of Financial Condition and Results of Operations
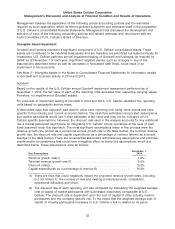
Developed operating market licenses (‘‘built licenses’’)
U.S. Cellular applies the build-out method to estimate the fair values of built licenses. The most
significant assumptions applied for purposes of the licenses impairment assessment were as follows:
November 1,
Key Assumptions 2014
Build-out period(1) ......................................... 5 years
Discount rate(2) ........................................... 8.75%
Terminal revenue growth rate ................................. 2.0%
Terminal capital expenditures as a percentage of revenue ............ 14.5%
Customer penetration rates .................................. 12.0-16.3%
(1) The build-out period represents the estimated time to perform a hypothetical build of the
network. Changes in the estimated build-out period can occur as a result of changes in
resources and technology. Such changes could negatively or positively impact the results.
(2) The discount rate used in the valuation of licenses is less than the discount rate used in the
valuation of reporting units for purposes of goodwill impairment testing. The discount rate
used for licenses includes a reduced company-specific risk premium as it is assumed a
market participant starting a greenfield build would construct and operate its network in an
optimal manner and would not be constrained by the current network and operations
associated with a mature wireless company. The discount rate is estimated based on the
overall risk-free interest rate adjusted for industry participant information, such as a typical
capital structure (i.e., debt-equity ratio), the after-tax cost of debt and the cost of equity. The
cost of equity takes into consideration the average risk specific to individual market
participants. The weighted average cost of capital may increase if borrowing costs rise,
market participants weight more of their capital structure towards equity (vs. debt), or other
elements affecting the estimated cost of equity increase.
As of November 1, 2014, the fair values of the built licenses units of accounting exceeded their
respective carrying values by amounts ranging from 12.8% to 42.9%. The discount rate would have to
increase to a range of 9.0% to 9.3% to yield estimated fair values of licenses in the respective units of
accounting that equal their respective carrying values at November 1, 2014.
Non-operating market licenses (‘‘unbuilt licenses’’)
For purposes of performing impairment testing of unbuilt licenses, the fair value of the unbuilt licenses is
assumed to have changed by the same percentage, and in the same direction, that the fair value of built
licenses measured using the build-out method changed during the period. There was no impairment loss
recognized related to unbuilt licenses as a result of the November 1, 2014 licenses impairment test.
24