Starwood 2003 Annual Report Download - page 35
Download and view the complete annual report
Please find page 35 of the 2003 Starwood annual report below. You can navigate through the pages in the report by either clicking on the pages listed below, or by using the keyword search tool below to find specific information within the annual report.-
 1
1 -
2
-
3
-
4
-
5
-
6
-
7
-
8
-
9
-
10
-
11
-
12
-
13
-
14
-
15
-
16
-
17
-
18
-
19
-
20
-
21
-
22
-
23
-
24
-
 25
25 -
 26
26 -
 27
27 -
 28
28 -
 29
29 -
 30
30 -
 31
31 -
 32
32 -
 33
33 -
 34
34 -
 35
35 -
 36
36 -
 37
37 -
 38
38 -
 39
39 -
 40
40 -
 41
41 -
 42
42 -
 43
43 -
 44
44 -
 45
45 -
46
-
47
-
48
-
49
-
50
-
51
-
52
-
53
-
54
-
55
-
56
-
57
-
58
-
59
-
60
-
61
-
62
-
63
-
64
-
65
-
66
-
67
-
68
-
69
-
70
-
71
-
72
-
73
-
74
-
75
-
76
-
77
-
78
-
79
-
80
-
81
-
82
-
83
-
84
-
85
-
86
-
87
-
88
-
89
-
90
-
91
-
92
-
93
-
94
-
95
-
96
-
97
-
98
-
99
-
100
-
101
-
102
-
103
-
104
-
105
-
106
-
107
-
108
-
109
-
110
-
111
-
112
-
113
-
114
-
115
-
116
-
117
-
118
-
119
-
120
-
121
-
122
-
123
-
124
-
125
-
126
-
127
-
128
-
129
-
130
-
131
-
132
-
133
-
134
-
135
-
136
-
137
-
138
 |
 |
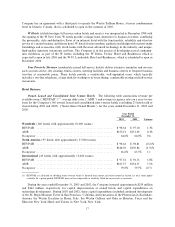
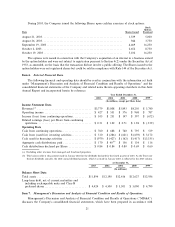
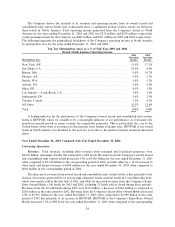
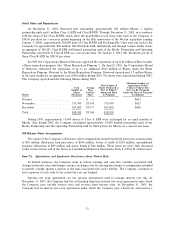
2002 period. The increase in REVPAR at these Same-Store Owned Hotels was attributed to an increase in
occupancy to 64.6% in the year ended December 31, 2003 when compared to 64.0% in the same period of 2002
and a slight increase in ADR of 0.3% to $152.12 for the year ended December 31, 2003 compared to $151.69
for the corresponding 2002 period. REVPAR at Same-Store Owned Hotels in North America decreased 0.2%
for the year ended December 31, 2003 when compared to the same period of 2002. The slight decrease in
REVPAR and revenues from owned, leased and consolidated joint venture hotels in North America was
primarily due to the decline in business transient demand as a result of the weakened global economies.
REVPAR at the Company's international Same-Store Owned Hotels increased by 5.8% for the year ended
December 31, 2003 when compared to the same period of 2002, primarily due to the favorable eÅect of foreign
currency translation. Including the impact of foreign currency, REVPAR for Same-Store Owned Hotels in
Europe increased 6.2%, in Latin America decreased 5.5% and in Asia PaciÑc increased 31.7% when compared
to 2002. Excluding the favorable eÅect of foreign exchange, REVPAR at the Company's Same-Store Owned
Hotels internationally decreased 6.5% for the year ended 2003 when compared to 2002 due to the weakened
global economies and adverse political and economic conditions.
The increase in other hotel and leisure revenues, for the year ended December 31, 2003 when compared
to the same period in 2002, primarily resulted from the increase in VOI sales of 30.7% to $361 million in 2003
compared to $276 million in 2002. Contract sales of VOI inventory increased 23.2% in the year ended
December 31, 2003 when compared to the same period in 2002, primarily as a result of sales at the Westin
Ka'anapali Ocean Resort Villas in Maui, Hawaii, which sold out the Ñrst phase prior to the opening, as well as
strong demand reÖected in our resorts in Scottsdale and Orlando in the latter part of the year. Management
and franchise fees revenue also increased as compared to the prior year. These increases were partially oÅset
by reduced interest income and increased insurance claims at the Company's captive insurance company.
Other revenues and expenses from managed and franchised properties increased to $851 million in 2003
when compared to $780 million in 2002, primarily due to the addition of hotels to the Company's portfolio of
managed and franchised hotels. These revenues represent reimbursements of costs incurred on behalf of
managed hotel properties and franchisees. These costs relate primarily to payroll costs at managed properties
where the Company is the employer. Since the reimbursements are made based upon the costs incurred with
no added margin, these revenues and corresponding expenses have no eÅect on the Company's operating
income and net income.
Operating Income. Total Company operating income (which includes $9 million of restructuring and
other special credits in 2003 and $7 million of restructuring and other special credits and $30 million of foreign
exchange gains related to the devaluation of the Argentine Peso in 2002) was $427 million for the year ended
December 31, 2003 compared to $551 million in the same period of 2002. Excluding depreciation and
amortization of $429 million and $488 million for the years ended December 31, 2003 and 2002, respectively,
operating income decreased 17.6% or $183 million to $856 million for the year ended December 31, 2003
when compared to $1.039 million in the same period in 2002, primarily due to the decline in operating income
at the Company's owned, leased and consolidated joint venture hotels as a result of the weakened global
economies, the war in Iraq and its aftermath and the SARS epidemic and the absence of the revenues and
corresponding operating income from the sold properties discussed above. Operating income at the Company's
owned, leased and consolidated joint venture hotels was $445 million for the year ended December 31, 2003
compared to $589 million in the same period of 2002. These hotels were also negatively impacted by increased
energy, workers compensation insurance and other health beneÑts related costs and reduced cancellation and
telecommunication fees in 2003 when compared to 2002. In addition, total Company operating income in
2003 was adversely impacted by the nonrecurring Argentina foreign exchange gains in 2002 of $30 million.
Operating income for the vacation ownership segment was $89 million in the year ended December 31,
2003 compared to $69 million in 2002. Excluding depreciation and amortization of $10 million in both years
ended December 31, 2003 and 2002, operating income increased to $99 million for the period ended
December 31, 2003 as compared to $79 million in the prior year primarily due to the increased sales from the
vacation ownership projects discussed above.
25