Starwood 2003 Annual Report Download - page 34
Download and view the complete annual report
Please find page 34 of the 2003 Starwood annual report below. You can navigate through the pages in the report by either clicking on the pages listed below, or by using the keyword search tool below to find specific information within the annual report.-
 1
1 -
2
-
3
-
4
-
5
-
6
-
7
-
8
-
9
-
10
-
11
-
12
-
13
-
14
-
15
-
16
-
17
-
18
-
19
-
20
-
21
-
22
-
23
-
 24
24 -
 25
25 -
 26
26 -
 27
27 -
 28
28 -
 29
29 -
 30
30 -
 31
31 -
 32
32 -
 33
33 -
 34
34 -
 35
35 -
 36
36 -
 37
37 -
 38
38 -
 39
39 -
 40
40 -
 41
41 -
 42
42 -
 43
43 -
 44
44 -
45
-
46
-
47
-
48
-
49
-
50
-
51
-
52
-
53
-
54
-
55
-
56
-
57
-
58
-
59
-
60
-
61
-
62
-
63
-
64
-
65
-
66
-
67
-
68
-
69
-
70
-
71
-
72
-
73
-
74
-
75
-
76
-
77
-
78
-
79
-
80
-
81
-
82
-
83
-
84
-
85
-
86
-
87
-
88
-
89
-
90
-
91
-
92
-
93
-
94
-
95
-
96
-
97
-
98
-
99
-
100
-
101
-
102
-
103
-
104
-
105
-
106
-
107
-
108
-
109
-
110
-
111
-
112
-
113
-
114
-
115
-
116
-
117
-
118
-
119
-
120
-
121
-
122
-
123
-
124
-
125
-
126
-
127
-
128
-
129
-
130
-
131
-
132
-
133
-
134
-
135
-
136
-
137
-
138
 |
 |

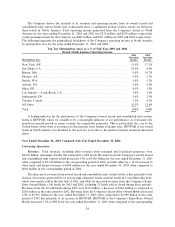
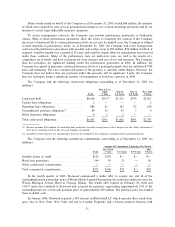
The Company derives the majority of its revenues and operating income from its owned, leased and
consolidated joint venture hotels and, as discussed above, a signiÑcant portion of these results are driven by
these hotels in North America. Total operating income generated from the Company's hotels in North
America for the years ending December 31, 2003 and 2002 was $233 million and $239 million, respectively
(total operating income for the Company was $427 million and $551 million for 2003 and 2002, respectively).
The following represents the geographical breakdown of the Company's operating income in North America
by metropolitan area for the years ended December 31, 2003 and 2002:
Top Ten Metropolitan Areas as a % of Full Year 2003 and 2002
Owned North America Operating Income
2003 2002
Operating Operating
Metropolitan Area Income Income
New York, NY ÏÏÏÏÏÏÏÏÏÏÏÏÏÏÏÏÏÏÏÏÏÏÏÏÏÏÏÏÏÏÏÏÏÏÏÏÏÏÏÏÏÏÏÏÏÏÏÏÏÏÏÏÏÏÏÏÏÏÏ 13.5% 17.1%
San Diego, CA ÏÏÏÏÏÏÏÏÏÏÏÏÏÏÏÏÏÏÏÏÏÏÏÏÏÏÏÏÏÏÏÏÏÏÏÏÏÏÏÏÏÏÏÏÏÏÏÏÏÏÏÏÏÏÏÏÏÏÏ 10.0% 8.4%
Boston, MA ÏÏÏÏÏÏÏÏÏÏÏÏÏÏÏÏÏÏÏÏÏÏÏÏÏÏÏÏÏÏÏÏÏÏÏÏÏÏÏÏÏÏÏÏÏÏÏÏÏÏÏÏÏÏÏÏÏÏÏÏÏÏ 9.6% 10.7%
Phoenix, AZ ÏÏÏÏÏÏÏÏÏÏÏÏÏÏÏÏÏÏÏÏÏÏÏÏÏÏÏÏÏÏÏÏÏÏÏÏÏÏÏÏÏÏÏÏÏÏÏÏÏÏÏÏÏÏÏÏÏÏÏÏÏ 5.9% 5.7%
Seattle, WAÏÏÏÏÏÏÏÏÏÏÏÏÏÏÏÏÏÏÏÏÏÏÏÏÏÏÏÏÏÏÏÏÏÏÏÏÏÏÏÏÏÏÏÏÏÏÏÏÏÏÏÏÏÏÏÏÏÏÏÏÏÏ 5.8% 5.2%
Atlanta, GAÏÏÏÏÏÏÏÏÏÏÏÏÏÏÏÏÏÏÏÏÏÏÏÏÏÏÏÏÏÏÏÏÏÏÏÏÏÏÏÏÏÏÏÏÏÏÏÏÏÏÏÏÏÏÏÏÏÏÏÏÏÏ 5.0% 5.4%
Maui, HI ÏÏÏÏÏÏÏÏÏÏÏÏÏÏÏÏÏÏÏÏÏÏÏÏÏÏÏÏÏÏÏÏÏÏÏÏÏÏÏÏÏÏÏÏÏÏÏÏÏÏÏÏÏÏÏÏÏÏÏÏÏÏÏÏ 4.3% 3.3%
Los Angeles Ì Long Beach, CA ÏÏÏÏÏÏÏÏÏÏÏÏÏÏÏÏÏÏÏÏÏÏÏÏÏÏÏÏÏÏÏÏÏÏÏÏÏÏÏÏÏÏÏÏ 3.8% 3.6%
Indianapolis, IN ÏÏÏÏÏÏÏÏÏÏÏÏÏÏÏÏÏÏÏÏÏÏÏÏÏÏÏÏÏÏÏÏÏÏÏÏÏÏÏÏÏÏÏÏÏÏÏÏÏÏÏÏÏÏÏÏÏÏ 3.4% 2.9%
Toronto, Canada ÏÏÏÏÏÏÏÏÏÏÏÏÏÏÏÏÏÏÏÏÏÏÏÏÏÏÏÏÏÏÏÏÏÏÏÏÏÏÏÏÏÏÏÏÏÏÏÏÏÏÏÏÏÏÏÏÏÏ 3.2% 4.1%
All Other ÏÏÏÏÏÏÏÏÏÏÏÏÏÏÏÏÏÏÏÏÏÏÏÏÏÏÏÏÏÏÏÏÏÏÏÏÏÏÏÏÏÏÏÏÏÏÏÏÏÏÏÏÏÏÏÏÏÏÏÏÏÏÏÏ 35.5% 33.6%
Total ÏÏÏÏÏÏÏÏÏÏÏÏÏÏÏÏÏÏÏÏÏÏÏÏÏÏÏÏÏÏÏÏÏÏÏÏÏÏÏÏÏÏÏÏÏÏÏÏÏÏÏÏÏÏÏÏÏÏÏÏÏÏÏÏÏÏÏÏ 100% 100%
A leading indicator for the performance of the Company's owned, leased and consolidated joint venture
hotels is REVPAR, which we consider to be a meaningful indicator of our performance, as it measures the
period-over-period growth in rooms revenue for comparable properties. This is particularly the case in the
United States where there is no impact on this measure from foreign exchange rates. REVPAR at our owned
hotels in North America has declined in the past two years due to the global economic downturn discussed
above.
Year Ended December 31, 2003 Compared with Year Ended December 31, 2002
Continuing Operations
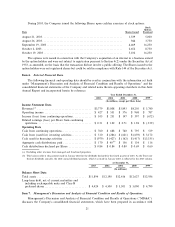
Revenues. Total revenues, including other revenues from managed and franchised properties, were
$4.630 billion, remaining virtually Öat compared to 2002 levels. Revenues from the Company's owned, leased
and consolidated joint venture hotels decreased 3.3% to $3.085 billion for the year ended December 31, 2003
when compared to $3.190 billion in the corresponding period of 2002, partially oÅset by a 12.3% increase in
other hotel and leisure revenues to $694 million for the year ended December 31, 2003 when compared to
$618 million in the corresponding period of 2002.
The decrease in revenues from owned, leased and consolidated joint venture hotels is due primarily to the
absence of revenues generated by 16 non-strategic domestic hotels and four hotels in Costa Smeralda, Italy,
which were mostly sold in the Ñrst half of 2003, and oÅset by increased revenues from the Company's Same-
Store Owned Hotels (140 hotels for 2003 and 2002, excluding 25 hotels sold or closed during these periods).
Revenues from the 20 sold hotels during 2003 were $110 million, a decrease of $140 million as compared to
$250 million in the same period of 2002. Revenues from the Company's Same-Store Owned Hotels increased
2.0% to $2.967 billion for the year ended December 31, 2003 when compared to $2.909 billion in the same
period of 2002 due primarily to an increase in REVPAR. REVPAR at the Company's Same-Store Owned
Hotels increased 1.3% to $98.34 for the year ended December 31, 2003 when compared to the corresponding
24