Starwood 2003 Annual Report Download - page 125
Download and view the complete annual report
Please find page 125 of the 2003 Starwood annual report below. You can navigate through the pages in the report by either clicking on the pages listed below, or by using the keyword search tool below to find specific information within the annual report.-
 1
1 -
2
-
3
-
4
-
5
-
6
-
7
-
8
-
9
-
10
-
11
-
12
-
13
-
14
-
15
-
16
-
17
-
18
-
19
-
20
-
21
-
22
-
23
-
24
-
25
-
26
-
27
-
28
-
29
-
30
-
31
-
32
-
33
-
34
-
35
-
36
-
37
-
38
-
39
-
40
-
41
-
42
-
43
-
44
-
45
-
46
-
47
-
48
-
49
-
50
-
51
-
52
-
53
-
54
-
55
-
56
-
57
-
58
-
59
-
60
-
61
-
62
-
63
-
64
-
65
-
66
-
67
-
68
-
69
-
70
-
71
-
72
-
73
-
74
-
75
-
76
-
77
-
78
-
79
-
80
-
81
-
82
-
83
-
84
-
85
-
86
-
87
-
88
-
89
-
90
-
91
-
92
-
93
-
94
-
95
-
96
-
97
-
98
-
99
-
100
-
101
-
102
-
103
-
104
-
105
-
106
-
107
-
108
-
109
-
110
-
111
-
112
-
113
-
114
-
 115
115 -
 116
116 -
 117
117 -
 118
118 -
 119
119 -
 120
120 -
 121
121 -
 122
122 -
 123
123 -
 124
124 -
 125
125 -
 126
126 -
 127
127 -
 128
128 -
 129
129 -
 130
130 -
 131
131 -
 132
132 -
 133
133 -
 134
134 -
 135
135 -
136
-
137
-
138
 |
 |

STARWOOD HOTELS & RESORTS WORLDWIDE, INC.
AND STARWOOD HOTELS & RESORTS
NOTES TO FINANCIAL STATEMENTS Ì (Continued)
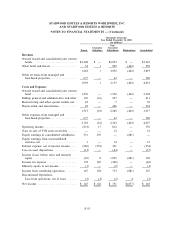
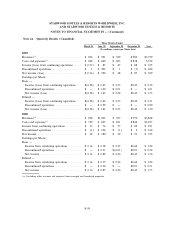
Note 24. Quarterly Results (Unaudited)
Three Months Ended
March 31 June 30 September 30 December 31 Year
(In millions, except per Share data)
2003
Revenues(a) ÏÏÏÏÏÏÏÏÏÏÏÏÏÏÏÏÏÏÏÏÏÏÏÏÏÏÏÏÏÏÏ $ 876 $ 991 $ 932 $ 980 $3,779
Costs and expenses(a) ÏÏÏÏÏÏÏÏÏÏÏÏÏÏÏÏÏÏÏÏÏÏ $ 822 $ 869 $ 823 $ 838 3,352
Income (loss) from continuing operations ÏÏÏÏÏ $ (117) $ 87 $ 47 $ 88 $ 105
Discontinued operations ÏÏÏÏÏÏÏÏÏÏÏÏÏÏÏÏÏÏÏÏ $ 1 $ 203 $ 1 $ (1) $ 204
Net income (loss) ÏÏÏÏÏÏÏÏÏÏÏÏÏÏÏÏÏÏÏÏÏÏÏÏÏ $ (116) $ 290 $ 48 $ 87 $ 309
Earnings per Share:
Basic Ì
Income (loss) from continuing operations ÏÏÏ $(0.58) $ 0.43 $ 0.23 $0.43 $ 0.52
Discontinued operations ÏÏÏÏÏÏÏÏÏÏÏÏÏÏÏÏÏÏ $ Ì $ 1.00 $ 0.01 $ Ì $ 1.01
Net income (loss) ÏÏÏÏÏÏÏÏÏÏÏÏÏÏÏÏÏÏÏÏÏÏÏ $(0.58) $ 1.43 $ 0.24 $0.43 $ 1.53
Diluted Ì
Income (loss) from continuing operations ÏÏÏ $(0.58) $ 0.42 $ 0.23 $0.42 $ 0.51
Discontinued operations ÏÏÏÏÏÏÏÏÏÏÏÏÏÏÏÏÏÏ $ Ì $ 0.99 $ Ì $ Ì $ 0.99
Net income (loss) ÏÏÏÏÏÏÏÏÏÏÏÏÏÏÏÏÏÏÏÏÏÏÏ $(0.58) $ 1.41 $ 0.23 $0.42 $ 1.50
2002
Revenues(a) ÏÏÏÏÏÏÏÏÏÏÏÏÏÏÏÏÏÏÏÏÏÏÏÏÏÏÏÏÏÏÏ $ 878 $1,003 $ 957 $ 970 $3,808
Costs and expenses(a) ÏÏÏÏÏÏÏÏÏÏÏÏÏÏÏÏÏÏÏÏÏÏ $ 759 $ 823 $ 831 $ 844 $3,257
Income from continuing operations ÏÏÏÏÏÏÏÏÏÏÏ $ 33 $ 76 $ 53 $ 89 $ 251
Discontinued operations ÏÏÏÏÏÏÏÏÏÏÏÏÏÏÏÏÏÏÏÏ $ (1) $ 104 $ (1) $ 2 $ 104
Net incomeÏÏÏÏÏÏÏÏÏÏÏÏÏÏÏÏÏÏÏÏÏÏÏÏÏÏÏÏÏÏÏ $ 32 $ 180 $ 52 $ 91 $ 355
Earnings per Share:
Basic Ì
Income from continuing operations ÏÏÏÏÏÏÏÏÏ $ 0.16 $ 0.38 $ 0.27 $0.44 $ 1.24
Discontinued operations ÏÏÏÏÏÏÏÏÏÏÏÏÏÏÏÏÏÏ $ Ì $ 0.51 $(0.01) $0.01 $ 0.52
Net incomeÏÏÏÏÏÏÏÏÏÏÏÏÏÏÏÏÏÏÏÏÏÏÏÏÏÏÏÏÏ $ 0.16 $ 0.89 $ 0.26 $0.45 $ 1.76
Diluted Ì
Income from continuing operations ÏÏÏÏÏÏÏÏÏ $ 0.16 $ 0.37 $ 0.26 $0.44 $ 1.22
Discontinued operations ÏÏÏÏÏÏÏÏÏÏÏÏÏÏÏÏÏÏ $ Ì $ 0.50 $ Ì $0.01 $ 0.51
Net incomeÏÏÏÏÏÏÏÏÏÏÏÏÏÏÏÏÏÏÏÏÏÏÏÏÏÏÏÏÏ $ 0.16 $ 0.87 $ 0.26 $0.45 $ 1.73
(a) Excluding other revenues and expenses from managed and franchised properties.
F-59