SkyWest Airlines 2014 Annual Report Download - page 73
Download and view the complete annual report
Please find page 73 of the 2014 SkyWest Airlines annual report below. You can navigate through the pages in the report by either clicking on the pages listed below, or by using the keyword search tool below to find specific information within the annual report.-
 1
1 -
2
-
3
-
4
-
5
-
6
-
7
-
8
-
9
-
10
-
11
-
12
-
13
-
14
-
15
-
16
-
17
-
18
-
19
-
20
-
21
-
22
-
23
-
24
-
25
-
26
-
27
-
28
-
29
-
30
-
31
-
32
-
33
-
34
-
35
-
36
-
37
-
38
-
39
-
40
-
41
-
42
-
43
-
44
-
45
-
46
-
47
-
48
-
49
-
50
-
51
-
52
-
53
-
54
-
55
-
56
-
57
-
58
-
59
-
60
-
61
-
62
-
 63
63 -
 64
64 -
 65
65 -
 66
66 -
 67
67 -
 68
68 -
 69
69 -
 70
70 -
 71
71 -
 72
72 -
 73
73 -
 74
74 -
 75
75 -
 76
76 -
 77
77 -
 78
78 -
 79
79 -
 80
80 -
 81
81 -
 82
82 -
 83
83 -
84
-
85
-
86
-
87
-
88
-
89
-
90
-
91
-
92
-
93
-
94
-
95
-
96
-
97
-
98
-
99
-
100
-
101
-
102
-
103
-
104
-
105
-
106
-
107
-
108
-
109
-
110
-
111
-
112
-
113
-
114
-
115
-
116
-
117
-
118
-
119
-
120
-
121
-
122
-
123
-
124
-
125
-
126
-
127
-
128
-
129
-
130
-
131
-
132
-
133
-
134
-
135
-
136
-
137
-
138
-
139
-
140
-
141
-
142
-
143
-
144
-
145
-
146
-
147
-
148
-
149
-
150
-
151
-
152
-
153
-
154
-
155
-
156
-
157
-
158
-
159
-
160
-
161
-
162
-
163
-
164
-
165
-
166
-
167
-
168
-
169
-
170
-
171
-
172
-
173
-
174
-
175
-
176
-
177
-
178
 |
 |

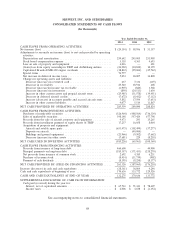
SKYWEST, INC. AND SUBSIDIARIES
CONSOLIDATED STATEMENTS OF CASH FLOWS
(In thousands)
Year Ended December 31,
2014 2013 2012
CASH FLOWS FROM OPERATING ACTIVITIES:
Net income (loss) ......................................... $(24,154) $ 58,956 $ 51,157
Adjustments to reconcile net income (loss) to net cash provided by operating
activities:
Depreciation and amortization ............................... 259,642 245,005 251,958
Stock based compensation expense ............................ 5,318 4,363 4,693
Loss on sale of property and equipment ........................ 4,016 — 621
(Gain) loss from equity ownership in TRIP and AirMekong airlines ..... (24,922) (10,830) 10,199
Capitalized Brasilia EMB-120 engine overhauls ................... (18,812) (29,606) (25,742)
Special items ........................................... 74,777 — —
Net increase in deferred income taxes .......................... 5,054 38,007 34,800
Changes in operating assets and liabilities:
Decrease (increase) in restricted cash ......................... 637 7,334 (119)
Decrease in receivables .................................. 25,540 18,916 408
Decrease (increase)in income tax receivable .................... (1,939) (840) 1,568
Decrease (increase) in inventories ........................... (890) (24,513) 1,630
Increase in other current assets and prepaid aircraft rents ........... (25,985) (31,578) (39,451)
Decrease in deferred aircraft credits .......................... (7,672) (8,432) (7,112)
Increase (decrease) in accounts payable and accrued aircraft rents ..... 5,852 17,594 (7,653)
Increase in other current liabilities ........................... 9,077 5,514 11,867
NET CASH PROVIDED BY OPERATING ACTIVITIES ............. 285,539 289,890 288,824
CASH FLOWS FROM INVESTING ACTIVITIES:
Purchases of marketable securities ............................ (326,964) (488,564) (736,330)
Sales of marketable securities ................................ 398,148 557,424 677,798
Proceeds from the sale of aircraft, property and equipment ........... 9,473 293 15,265
Proceeds from installment payment of equity shares of TRIP .......... 17,237 16,658 8,064
Acquisition of property and equipment:
Aircraft and rotable spare parts ............................. (653,473) (102,499) (57,277)
Deposits on aircraft ..................................... — (40,000) —
Buildings and ground equipment ............................ (21,966) (9,502) (7,662)
Decrease (increase) in other assets .......................... (7,681) 229 (8,218)
NET CASH USED IN INVESTING ACTIVITIES .................. (585,226) (65,961) (108,360)
CASH FLOWS FROM FINANCING ACTIVITIES:
Proceeds from issuance of long-term debt ....................... 460,600 — 44,900
Principal payments on long-term debt .......................... (185,357) (171,453) (218,270)
Net proceeds from issuance of common stock ..................... 2,692 4,385 6,231
Purchase of treasury stock .................................. (8,414) (11,739) (902)
Payment of cash dividends .................................. (8,195) (8,258) (8,177)
NET CASH PROVIDED BY (USED IN) FINANCING ACTIVITIES ..... 261,326 (187,065) (176,218)
Increase (decrease) in cash and cash equivalents .................... (38,361) 36,864 4,246
Cash and cash equivalents at beginning of year ..................... 170,636 133,772 129,526
CASH AND CASH EQUIVALENTS AT END OF YEAR ............. 132,275 170,636 133,772
SUPPLEMENTAL DISCLOSURE OF CASH FLOW INFORMATION:
Cash paid (received) during the year for:
Interest, net of capitalized amounts .......................... $ 67,763 $ 71,323 $ 78,407
Income taxes ......................................... $ 2,006 $ 3,678 $ (1,354)
See accompanying notes to consolidated financial statements.
68