SkyWest Airlines 2014 Annual Report Download - page 63
Download and view the complete annual report
Please find page 63 of the 2014 SkyWest Airlines annual report below. You can navigate through the pages in the report by either clicking on the pages listed below, or by using the keyword search tool below to find specific information within the annual report.-
 1
1 -
2
-
3
-
4
-
5
-
6
-
7
-
8
-
9
-
10
-
11
-
12
-
13
-
14
-
15
-
16
-
17
-
18
-
19
-
20
-
21
-
22
-
23
-
24
-
25
-
26
-
27
-
28
-
29
-
30
-
31
-
32
-
33
-
34
-
35
-
36
-
37
-
38
-
39
-
40
-
41
-
42
-
43
-
44
-
45
-
46
-
47
-
48
-
49
-
50
-
51
-
52
-
 53
53 -
 54
54 -
 55
55 -
 56
56 -
 57
57 -
 58
58 -
 59
59 -
 60
60 -
 61
61 -
 62
62 -
 63
63 -
 64
64 -
 65
65 -
 66
66 -
 67
67 -
 68
68 -
 69
69 -
 70
70 -
 71
71 -
 72
72 -
 73
73 -
74
-
75
-
76
-
77
-
78
-
79
-
80
-
81
-
82
-
83
-
84
-
85
-
86
-
87
-
88
-
89
-
90
-
91
-
92
-
93
-
94
-
95
-
96
-
97
-
98
-
99
-
100
-
101
-
102
-
103
-
104
-
105
-
106
-
107
-
108
-
109
-
110
-
111
-
112
-
113
-
114
-
115
-
116
-
117
-
118
-
119
-
120
-
121
-
122
-
123
-
124
-
125
-
126
-
127
-
128
-
129
-
130
-
131
-
132
-
133
-
134
-
135
-
136
-
137
-
138
-
139
-
140
-
141
-
142
-
143
-
144
-
145
-
146
-
147
-
148
-
149
-
150
-
151
-
152
-
153
-
154
-
155
-
156
-
157
-
158
-
159
-
160
-
161
-
162
-
163
-
164
-
165
-
166
-
167
-
168
-
169
-
170
-
171
-
172
-
173
-
174
-
175
-
176
-
177
-
178
 |
 |

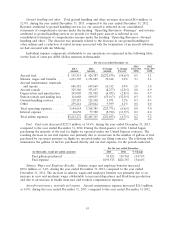
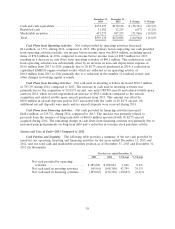
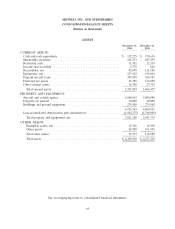
December 31, December 31,
2014 2013 $ Change % Change
Cash and cash equivalents .................... $132,275 $170,636 $ (38,361) (22.5)%
Restricted cash ............................ 11,582 12,219 (637) (5.2)%
Marketable securities ........................ 415,273 487,239 (71,966) (14.8)%
Total .................................... $559,130 $670,094 (110,964) (16.6)%
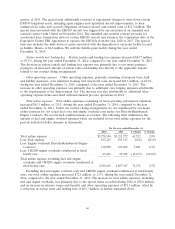
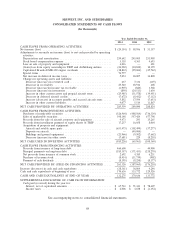
Cash Flows from Operating Activities. Net cash provided by operating activities decreased
$4.4 million, or 1.5%, during 2014, compared to 2013. The primary factors impacting our cash provided
from operating activities include: our income before income taxes was $58.4 million, excluding special
items of $74.8 million, in 2014, compared to income before income taxes of $98.5 million for 2013,
resulting in a decrease in cash flows from operating activities of $40.1 million. This reduction in cash
from operating activities was substantially offset by an increase in non-cash depreciation expense of
$14.6 million from 2013 to 2014, primarily due to 20 E175 aircraft purchased in 2014; a reduction in
capitalized EMB120 engine overhaul events, which are reflected as an operating activity, of
$10.8 million from 2013 to 2014 primarily due to a reduction in the number of overhaul events; and
other changes in working capital accounts.
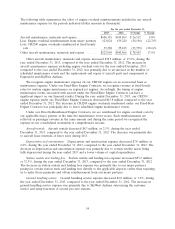
Cash Flows from Investing Activities. Net cash used in investing activities increased $519.3 million,
or 787.2% during 2014, compared to 2013. The increase in cash used in investing activities was
primarily due to the acquisition of 20 E175 aircraft, one used CRJ700 aircraft and related rotable spare
assets in 2014, which in total represented an increase of $563.4 million compared to the aircraft
acquisition and related rotable spare aircraft purchases from 2013. This amount was offset by
$40.0 million in aircraft deposits paid in 2013 associated with the order of 40 E175 aircraft. No
additional aircraft deposits were made and no aircraft deposits were received during 2014.
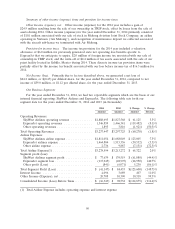
Cash Flows from Financing Activities. Net cash provided by financing activities increased
$448.4 million, or 239.7%, during 2014, compared to 2013. The increase was primarily related to
proceeds from the issuance of long-term debt of $460.6 million associated with 20 E175 aircraft
acquired during 2014. The remaining change in cash flows from financing activities was primarily due to
increased principal payments on long-term debt and a reduction in treasury stock purchase activity.
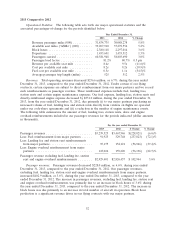
Sources and Uses of Cash—2013 Compared to 2012
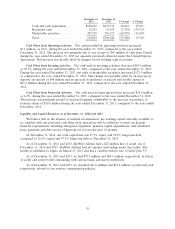
Cash Position and Liquidity. The following table provides a summary of the net cash provided by
(used in) our operating, investing and financing activities for the years ended December 31, 2013 and
2012, and our total cash and marketable securities position as of December 31, 2013 and December 31,
2012 (in thousands).
For the year ended December 31,
2013 2012 $ Change % Change
Net cash provided by operating
activities ..................... $289,890 $ 288,824 1,066 0.4%
Net cash used in investing activities . . . (65,961) (108,360) 42,399 39.1%
Net cash used in financing activities . . . (187,065) (176,218) (10,847) (6.2)%
58