SkyWest Airlines 2014 Annual Report Download - page 52
Download and view the complete annual report
Please find page 52 of the 2014 SkyWest Airlines annual report below. You can navigate through the pages in the report by either clicking on the pages listed below, or by using the keyword search tool below to find specific information within the annual report.-
 1
1 -
2
-
3
-
4
-
5
-
6
-
7
-
8
-
9
-
10
-
11
-
12
-
13
-
14
-
15
-
16
-
17
-
18
-
19
-
20
-
21
-
22
-
23
-
24
-
25
-
26
-
27
-
28
-
29
-
30
-
31
-
32
-
33
-
34
-
35
-
36
-
37
-
38
-
39
-
40
-
41
-
 42
42 -
 43
43 -
 44
44 -
 45
45 -
 46
46 -
 47
47 -
 48
48 -
 49
49 -
 50
50 -
 51
51 -
 52
52 -
 53
53 -
 54
54 -
 55
55 -
 56
56 -
 57
57 -
 58
58 -
 59
59 -
 60
60 -
 61
61 -
 62
62 -
63
-
64
-
65
-
66
-
67
-
68
-
69
-
70
-
71
-
72
-
73
-
74
-
75
-
76
-
77
-
78
-
79
-
80
-
81
-
82
-
83
-
84
-
85
-
86
-
87
-
88
-
89
-
90
-
91
-
92
-
93
-
94
-
95
-
96
-
97
-
98
-
99
-
100
-
101
-
102
-
103
-
104
-
105
-
106
-
107
-
108
-
109
-
110
-
111
-
112
-
113
-
114
-
115
-
116
-
117
-
118
-
119
-
120
-
121
-
122
-
123
-
124
-
125
-
126
-
127
-
128
-
129
-
130
-
131
-
132
-
133
-
134
-
135
-
136
-
137
-
138
-
139
-
140
-
141
-
142
-
143
-
144
-
145
-
146
-
147
-
148
-
149
-
150
-
151
-
152
-
153
-
154
-
155
-
156
-
157
-
158
-
159
-
160
-
161
-
162
-
163
-
164
-
165
-
166
-
167
-
168
-
169
-
170
-
171
-
172
-
173
-
174
-
175
-
176
-
177
-
178
 |
 |

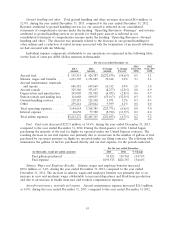
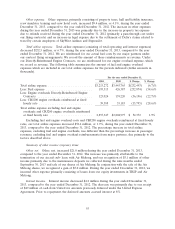
operations, partially offset by reductions in the ExpressJet fleet size, severe weather experienced in the
first half of 2014 and reduced contract performance incentives.
Ground handling and other. Total ground handling and other revenues increased $11.3 million, or
19.3%, during the year ended December 31, 2014, compared to the year ended December 31, 2013.
Ground handling and other revenue primarily consists of ground handling services we provide to third-
party airlines and government subsidies we receive for operating certain routes. Revenues associated
with ground handling services we provide for our aircraft are recorded as passenger revenues. The
increase in ground handling and other revenue was primarily due to an increased volume of departures
during the 2014 year on routes subject to government subsidies.
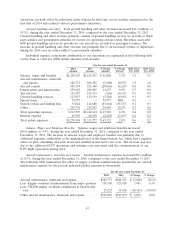
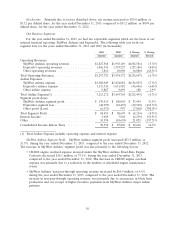
Individual expense components attributable to our operations are expressed in the following table
on the basis of cents per ASM (dollar amounts in thousands).
For the year ended December 31,
2014 2013 $ Change % Change 2014 Cents 2013 Cents
Amount Amount Amount Percent Per ASM Per ASM
Salaries, wages and benefits .... $1,258,155 $1,211,307 $ 46,848 3.9% 3.3 3.1
Aircraft maintenance, materials
and repairs .............. 682,773 686,381 (3,608) (0.5)% 1.8 1.8
Aircraft rentals ............. 305,334 325,360 (20,026) (6.2)% 0.8 0.8
Depreciation and amortization . . 259,642 245,005 14,637 6.0% 0.7 0.6
Aircraft fuel ............... 193,247 193,513 (266) (0.1)% 0.5 0.5
Ground handling services ..... 123,917 129,119 (5,202) (4.0)% 0.3 0.3
Special items .............. 74,777 — 74,777 NM 0.2 —
Station rentals and landing fees . 51,024 114,688 (63,664) (55.5)% 0.1 0.3
Other .................... 263,730 239,241 24,489 10.2% 0.7 0.6
Total operating expenses ...... 3,212,599 $3,144,614 $ 67,985 2.2% 8.4 8.0
Interest expense ............ 65,995 68,658 (2,663) (3.9)% 0.2 0.2
Total airline expenses ........ $3,278,594 $3,213,272 $ 65,322 2.0% 8.6 8.2
Salaries, Wages and Employee Benefits. Salaries, wages and employee benefits increased
$46.8 million, or 3.9%, during the year ended December 31, 2014, compared to the year ended
December 31, 2013. The increase in salaries, wages and employee benefits was primarily due to
additional expenses attributable to the implementation of the Improvement Act, which had a negative
effect on pilot scheduling and work hours and resulted in increased crew costs. The increase was also
due to the additional E175 operations and training costs associated with the commencement of our
E175 flight operations during 2014.
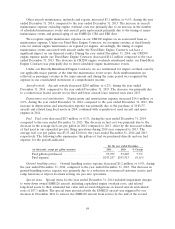
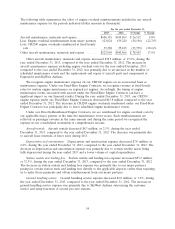
Aircraft maintenance, materials and repairs. Aircraft maintenance expense decreased $3.6 million,
or 0.5%, during the year ended December 31, 2014, compared to the year ended December 31 2013.
The following table summarizes the effect of engine overhaul reimbursements included in our aircraft
maintenance expense for the periods indicated (dollar amounts in thousands).
For the year ended December 31,
2014 2013 $ Change % Change
Aircraft maintenance, materials and repairs ............ $682,773 $686,381 $ (3,608) (0.5)%
Less: Engine overhaul reimbursement from major partners 130,505 123,024 7,481 6.1%
Less: CRJ200 engine overhauls reimbursed at fixed hourly
rate ....................................... 25,223 39,388 (14,165) (36.0)%
Other aircraft maintenance, materials and repairs ....... $527,045 $523,969 $ 3,076 0.6%
47