SkyWest Airlines 2014 Annual Report Download - page 57
Download and view the complete annual report
Please find page 57 of the 2014 SkyWest Airlines annual report below. You can navigate through the pages in the report by either clicking on the pages listed below, or by using the keyword search tool below to find specific information within the annual report.-
 1
1 -
2
-
3
-
4
-
5
-
6
-
7
-
8
-
9
-
10
-
11
-
12
-
13
-
14
-
15
-
16
-
17
-
18
-
19
-
20
-
21
-
22
-
23
-
24
-
25
-
26
-
27
-
28
-
29
-
30
-
31
-
32
-
33
-
34
-
35
-
36
-
37
-
38
-
39
-
40
-
41
-
42
-
43
-
44
-
45
-
46
-
 47
47 -
 48
48 -
 49
49 -
 50
50 -
 51
51 -
 52
52 -
 53
53 -
 54
54 -
 55
55 -
 56
56 -
 57
57 -
 58
58 -
 59
59 -
 60
60 -
 61
61 -
 62
62 -
 63
63 -
 64
64 -
 65
65 -
 66
66 -
 67
67 -
68
-
69
-
70
-
71
-
72
-
73
-
74
-
75
-
76
-
77
-
78
-
79
-
80
-
81
-
82
-
83
-
84
-
85
-
86
-
87
-
88
-
89
-
90
-
91
-
92
-
93
-
94
-
95
-
96
-
97
-
98
-
99
-
100
-
101
-
102
-
103
-
104
-
105
-
106
-
107
-
108
-
109
-
110
-
111
-
112
-
113
-
114
-
115
-
116
-
117
-
118
-
119
-
120
-
121
-
122
-
123
-
124
-
125
-
126
-
127
-
128
-
129
-
130
-
131
-
132
-
133
-
134
-
135
-
136
-
137
-
138
-
139
-
140
-
141
-
142
-
143
-
144
-
145
-
146
-
147
-
148
-
149
-
150
-
151
-
152
-
153
-
154
-
155
-
156
-
157
-
158
-
159
-
160
-
161
-
162
-
163
-
164
-
165
-
166
-
167
-
168
-
169
-
170
-
171
-
172
-
173
-
174
-
175
-
176
-
177
-
178
 |
 |

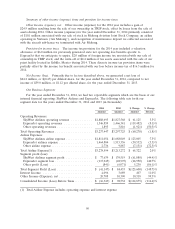
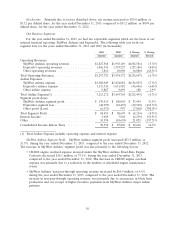
2013 Compared to 2012
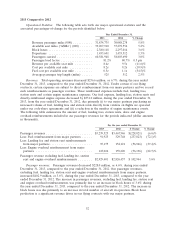
Operational Statistics. The following table sets forth our major operational statistics and the
associated percentages-of-change for the periods identified below.
Year Ended December 31,
2013 2012 % Change
Revenue passenger miles (000) ........... 31,834,735 30,088,278 5.8%
Available seat miles (‘‘ASMs’’) (000) ....... 39,207,910 37,278,554 5.2%
Block hours ......................... 2,380,118 2,297,014 3.6%
Departures ......................... 1,453,601 1,435,512 1.3%
Passengers carried .................... 60,581,948 58,803,690 3.0%
Passenger load factor .................. 81.2% 80.7% 0.5 pts
Revenue per available seat mile .......... 8.4¢ 9.5¢ (11.6)%
Cost per available seat mile ............. 8.2¢ 9.2¢ (10.9)%
Fuel cost per available seat mile .......... 0.5¢ 1.1¢ (54.5)%
Average passenger trip length (miles) ...... 525 512 2.5%
Revenues. Total operating revenues decreased $236.6 million, or 6.7%, during the year ended
December 31, 2013, compared to the year ended December 31, 2012. Under certain of our flying
contracts, certain expenses are subject to direct reimbursement from our major partners and we record
such reimbursements as passenger revenue. These reimbursed expenses include fuel, landing fees,
station rents and certain engine maintenance expenses. Our fuel expense, landing fees, station rents and
directly-reimbursed engine expense decreased by $331.0 million, during the year ended December 31,
2013, from the year ended December 31, 2012, due primarily (i) to our major partners purchasing an
increased volume of fuel, landing fees and station rents directly from vendors on flights we operated
under our code-share agreements and (ii) a reduction in the number of engine maintenance events.
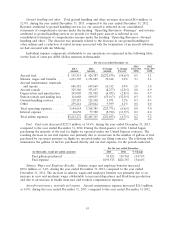
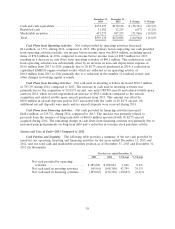
The following table summarizes the amount of fuel, landing fees, station rents, deice and engine
overhaul reimbursements included in our passenger revenues for the periods indicated (dollar amounts
in thousands).
For the year ended December 31,
2013 2012 $ Change % Change
Passenger revenues .......................... $3,239,525 $3,467,546 $(228,021) (6.6)%
Less: Fuel reimbursement from major partners ...... 91,925 329,748 (237,823) (72.1)%
Less: Landing fee and station rent reimbursements
from major partners ........................ 95,175 152,121 (56,946) (37.4)%
Less: Engine overhaul reimbursement from major
partners ................................ 123,024 159,220 (36,196) (22.7)%
Passenger revenue excluding fuel, landing fee, station
rent and engine overhaul reimbursements ........ $2,929,401 $2,826,457 $ 102,944 3.6%
Passenger revenues. Passenger revenues decreased $228.0 million, or 6.6%, during year ended
December 31, 2013, compared to the year ended December 31, 2012. Our passenger revenues,
excluding fuel, landing fee, station rent and engine overhaul reimbursements from major partners,
increased $102.9 million, or 3.6%, during the year ended December 31, 2013, compared to the year
ended December 31, 2012. The increase in passenger revenues, excluding fuel, landing fee, station rent
and engine overhaul reimbursements, was primarily due to an increase in block hours of 3.6% during
the year ended December 31, 2013, compared to the year ended December 31, 2012. The increase in
block hours was due primarily to an increase in total number of aircraft in operation. Block hour
production is a significant revenue driver in our flying contracts with our major partners.
52