SkyWest Airlines 2014 Annual Report Download - page 62
Download and view the complete annual report
Please find page 62 of the 2014 SkyWest Airlines annual report below. You can navigate through the pages in the report by either clicking on the pages listed below, or by using the keyword search tool below to find specific information within the annual report.-
 1
1 -
2
-
3
-
4
-
5
-
6
-
7
-
8
-
9
-
10
-
11
-
12
-
13
-
14
-
15
-
16
-
17
-
18
-
19
-
20
-
21
-
22
-
23
-
24
-
25
-
26
-
27
-
28
-
29
-
30
-
31
-
32
-
33
-
34
-
35
-
36
-
37
-
38
-
39
-
40
-
41
-
42
-
43
-
44
-
45
-
46
-
47
-
48
-
49
-
50
-
51
-
 52
52 -
 53
53 -
 54
54 -
 55
55 -
 56
56 -
 57
57 -
 58
58 -
 59
59 -
 60
60 -
 61
61 -
 62
62 -
 63
63 -
 64
64 -
 65
65 -
 66
66 -
 67
67 -
 68
68 -
 69
69 -
 70
70 -
 71
71 -
 72
72 -
73
-
74
-
75
-
76
-
77
-
78
-
79
-
80
-
81
-
82
-
83
-
84
-
85
-
86
-
87
-
88
-
89
-
90
-
91
-
92
-
93
-
94
-
95
-
96
-
97
-
98
-
99
-
100
-
101
-
102
-
103
-
104
-
105
-
106
-
107
-
108
-
109
-
110
-
111
-
112
-
113
-
114
-
115
-
116
-
117
-
118
-
119
-
120
-
121
-
122
-
123
-
124
-
125
-
126
-
127
-
128
-
129
-
130
-
131
-
132
-
133
-
134
-
135
-
136
-
137
-
138
-
139
-
140
-
141
-
142
-
143
-
144
-
145
-
146
-
147
-
148
-
149
-
150
-
151
-
152
-
153
-
154
-
155
-
156
-
157
-
158
-
159
-
160
-
161
-
162
-
163
-
164
-
165
-
166
-
167
-
168
-
169
-
170
-
171
-
172
-
173
-
174
-
175
-
176
-
177
-
178
 |
 |

• SkyWest Airlines’ salaries, wages and employee benefits increased $20.3 million, or 3.7%, during
the year ended December 31, 2013, compared to the year ended December 31, 2012, primarily
due to increased block-hour production.
• SkyWest Airlines’ legal expense increased by $2.8 million. The increase in legal expense was
primarily related to the settlement of our dispute with Delta regarding non-revenue positive
space flying by employees of SkyWest Airlines and ExpressJet.
• SkyWest Airlines’ aircraft maintenance expense, excluding reimbursed engine overhauls,
increased by $26.7 million, or 12.5%, during the year ended December 31, 2013, compared to
the year ended December 31, 2012, which was primarily attributable to an increase in scheduled
maintenance events and the replacement and repair of aircraft parts and components.
• SkyWest Airlines’ ground handling service expense increased $9.3 million, or 12.6%, during the
year ended December 31, 2013, compared to the year ended December 31, 2012. The increase
in ground handling service expense was primarily due to SkyWest Airlines outsourcing the
customer service and ramp functions of several pro-rate stations.
ExpressJet Segment Loss. ExpressJet segment loss increased $30.5 million, or 165.5%, during the
year ended December 31, 2013, compared to the year ended December 31, 2012. The increase in
ExpressJet segment loss was due primarily to the following factors:
• ExpressJet’s aircraft maintenance expense, excluding reimbursed engine overhauls, increased by
$45.7 million, or 20.6%, during the year ended December 31, 2013, compared to the year ended
December 31, 2012, which was primarily attributable to an increase in scheduled maintenance
events and the replacement and repair of aircraft parts and components.
• ExpressJet’s salaries, wages and employee benefits increased $19.4 million, or 3.1%, during the
year ended December 31, 2013, compared to the year ended December 31, 2012, primarily due
to increased block hour production.
• ExpressJet’s depreciation and amortization expense decreased $8.7 million, or 8.9%, during the
year ended December 31, 2013, compared to the year ended December 31, 2012, primarily due
to certain rotable assets being fully depreciated during the year ended 2013 and a lower volume
of capital expenditures.
• ExpressJet’s non-pass-through operating revenue increased by $25.3 million, or 2.4%, during the
year ended December 31, 2013, compared to the year ended December 31, 2012. The increase
in non-pass through operating revenue was primarily due to an increase in block hour
production, offset by a reduction in contract performance incentives.
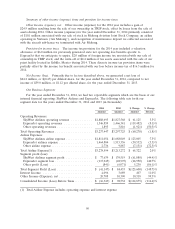
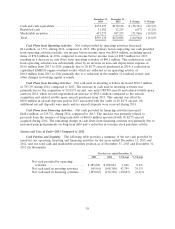
Liquidity and Capital Resources
Sources and Uses of Cash—2014 Compared to 2013
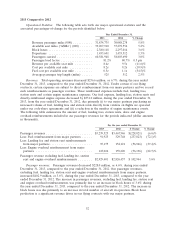
Cash Position and Liquidity. The following table provides a summary of the net cash provided by
(used in) our operating, investing and financing activities for the years ended December 31, 2014 and
2013, and our total cash and marketable securities position as of December 31, 2014 and December 31,
2013 (in thousands).
For the year ended December 31,
2014 2013 $ Change % Change
Net cash provided by operating activities ............ $285,539 $ 289,890 $ (4,351) (1.5)%
Net cash used in investing activities ............... (585,226) (65,961) (519,265) 787.2%
Net cash provided by (used in) financing activities ..... 261,326 (187,065) 448,391 (239.7)%
57