SkyWest Airlines 2014 Annual Report Download - page 61
Download and view the complete annual report
Please find page 61 of the 2014 SkyWest Airlines annual report below. You can navigate through the pages in the report by either clicking on the pages listed below, or by using the keyword search tool below to find specific information within the annual report.-
 1
1 -
2
-
3
-
4
-
5
-
6
-
7
-
8
-
9
-
10
-
11
-
12
-
13
-
14
-
15
-
16
-
17
-
18
-
19
-
20
-
21
-
22
-
23
-
24
-
25
-
26
-
27
-
28
-
29
-
30
-
31
-
32
-
33
-
34
-
35
-
36
-
37
-
38
-
39
-
40
-
41
-
42
-
43
-
44
-
45
-
46
-
47
-
48
-
49
-
50
-
 51
51 -
 52
52 -
 53
53 -
 54
54 -
 55
55 -
 56
56 -
 57
57 -
 58
58 -
 59
59 -
 60
60 -
 61
61 -
 62
62 -
 63
63 -
 64
64 -
 65
65 -
 66
66 -
 67
67 -
 68
68 -
 69
69 -
 70
70 -
 71
71 -
72
-
73
-
74
-
75
-
76
-
77
-
78
-
79
-
80
-
81
-
82
-
83
-
84
-
85
-
86
-
87
-
88
-
89
-
90
-
91
-
92
-
93
-
94
-
95
-
96
-
97
-
98
-
99
-
100
-
101
-
102
-
103
-
104
-
105
-
106
-
107
-
108
-
109
-
110
-
111
-
112
-
113
-
114
-
115
-
116
-
117
-
118
-
119
-
120
-
121
-
122
-
123
-
124
-
125
-
126
-
127
-
128
-
129
-
130
-
131
-
132
-
133
-
134
-
135
-
136
-
137
-
138
-
139
-
140
-
141
-
142
-
143
-
144
-
145
-
146
-
147
-
148
-
149
-
150
-
151
-
152
-
153
-
154
-
155
-
156
-
157
-
158
-
159
-
160
-
161
-
162
-
163
-
164
-
165
-
166
-
167
-
168
-
169
-
170
-
171
-
172
-
173
-
174
-
175
-
176
-
177
-
178
 |
 |

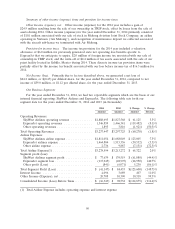
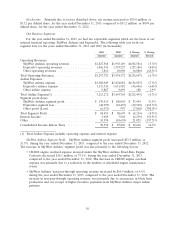
Net Income. Primarily due to factors described above, net income increased to $59.0 million, or
$1.12 per diluted share, for the year ended December 31, 2013, compared to $51.2 million, or $0.99 per
diluted share, for the year ended December 31, 2012.
Our Business Segments:
For the year ended December 31, 2013, we had two reportable segments which are the basis of our
internal financial reporting: SkyWest Airlines and ExpressJet. The following table sets forth our
segment data for the years ended December 31, 2013 and 2012 (in thousands):
2013 2012 $ Change % Change
Amount Amount Amount Percent
Operating Revenues:
SkyWest Airlines operating revenue ............ $1,827,568 $1,930,149 $(102,581) (5.3)%
ExpressJet operating revenues ................ 1,466,341 1,593,527 (127,186) (8.0)%
Other operating revenues .................... 3,816 10,696 (6,880) (64.3)%
Total Operating Revenues ..................... $3,297,725 $3,534,372 $(236,647) (6.7)%
Airline Expenses:
SkyWest airlines expense .................... $1,688,049 $1,824,084 $(136,035) (7.5)%
ExpressJet airlines expense ................... 1,515,336 1,611,982 (96,646) (6.0)%
Other airline expense ....................... 9,887 9,699 188 1.9%
Total Airline Expense(1) ...................... 3,213,272 $3,445,765 $(232,493) (6.7)%
Segment profit (loss):
SkyWest Airlines segment profit ............... $ 139,519 $ 106,065 $ 33,454 31.5%
ExpressJet segment loss ..................... (48,995) (18,455) (30,540) (165.5)%
Other profit (Loss) ........................ (6,071) 997 (7,068) (708.9)%
Total Segment Profit ......................... $ 84,453 $ 88,607 $ (4,154) (4.7)%
Interest Income ............................ 3,689 7,928 (4,239) (53.5)%
Other .................................... 10,390 (10,639) 21,029 (197.7)%
Consolidated Income Before Taxes ............... 98,532 $ 85,896 $ 12,636 14.7%
(1) Total Airline Expense includes operating expense and interest expense
SkyWest Airlines Segment Profit. SkyWest Airlines segment profit increased $33.5 million, or
31.5%, during the year ended December 31, 2013, compared to the year ended December 31, 2012.
The increase in SkyWest Airlines’ segment profit was due primarily to the following factors:
• CRJ200 engine overhaul expense incurred under the SkyWest Airlines Fixed-Rate Engine
Contracts decreased $18.1 million, or 37.6%, during the year ended December 31, 2013,
compared to the year ended December 31, 2012. The decrease in CRJ200 engine overhaul
expense was primarily due to a reduction in the number of scheduled engine maintenance
events.
• SkyWest Airlines’ non-pass-through operating revenue increased by $65.9 million, or 4.6%,
during the year ended December 31, 2013, compared to the year ended December 31, 2012. The
increase in non-pass-through operating revenue, was primarily due to an increase in block hour
production and our receipt of higher incentive payments from SkyWest Airlines’ major airline
partners.
56