SkyWest Airlines 2014 Annual Report Download - page 42
Download and view the complete annual report
Please find page 42 of the 2014 SkyWest Airlines annual report below. You can navigate through the pages in the report by either clicking on the pages listed below, or by using the keyword search tool below to find specific information within the annual report.-
 1
1 -
2
-
3
-
4
-
5
-
6
-
7
-
8
-
9
-
10
-
11
-
12
-
13
-
14
-
15
-
16
-
17
-
18
-
19
-
20
-
21
-
22
-
23
-
24
-
25
-
26
-
27
-
28
-
29
-
30
-
31
-
 32
32 -
 33
33 -
 34
34 -
 35
35 -
 36
36 -
 37
37 -
 38
38 -
 39
39 -
 40
40 -
 41
41 -
 42
42 -
 43
43 -
 44
44 -
 45
45 -
 46
46 -
 47
47 -
 48
48 -
 49
49 -
 50
50 -
 51
51 -
 52
52 -
53
-
54
-
55
-
56
-
57
-
58
-
59
-
60
-
61
-
62
-
63
-
64
-
65
-
66
-
67
-
68
-
69
-
70
-
71
-
72
-
73
-
74
-
75
-
76
-
77
-
78
-
79
-
80
-
81
-
82
-
83
-
84
-
85
-
86
-
87
-
88
-
89
-
90
-
91
-
92
-
93
-
94
-
95
-
96
-
97
-
98
-
99
-
100
-
101
-
102
-
103
-
104
-
105
-
106
-
107
-
108
-
109
-
110
-
111
-
112
-
113
-
114
-
115
-
116
-
117
-
118
-
119
-
120
-
121
-
122
-
123
-
124
-
125
-
126
-
127
-
128
-
129
-
130
-
131
-
132
-
133
-
134
-
135
-
136
-
137
-
138
-
139
-
140
-
141
-
142
-
143
-
144
-
145
-
146
-
147
-
148
-
149
-
150
-
151
-
152
-
153
-
154
-
155
-
156
-
157
-
158
-
159
-
160
-
161
-
162
-
163
-
164
-
165
-
166
-
167
-
168
-
169
-
170
-
171
-
172
-
173
-
174
-
175
-
176
-
177
-
178
 |
 |

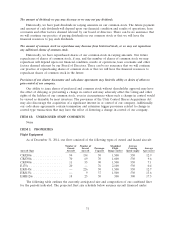
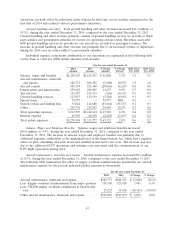
ITEM 6. SELECTED FINANCIAL DATA
The following selected financial and operating data should be read in conjunction with
‘‘Management’s Discussion and Analysis of Financial Condition and Results of Operations,’’ and our
consolidated financial statements and related notes included elsewhere in this Report.
Selected Consolidated Financial Data (amounts in thousands, except per share data):
Year Ended December 31,
2014 2013 2012 2011 2010(2)
Operating revenues ....... $3,237,447 $3,297,725 $3,534,372 $3,654,923 $2,765,145
Operating income ......... 24,848 153,111 165,987 41,105 201,826
Net income (loss) ......... (24,154) 58,956 51,157 (27,335) 96,350
Net income (loss) per
common share:
Basic ................ $ (0.47) $ 1.14 $ 1.00 $ (0.52) $ 1.73
Diluted ............... $ (0.47) $ 1.12 $ 0.99 $ (0.52) $ 1.70
Weighted average shares:
Basic ................ 51,237 51,688 51,090 52,201 55,610
Diluted ............... 51,237 52,422 51,746 52,201 56,526
Total assets ............. $4,409,928 $4,233,219 $4,254,637 $4,281,908 $4,456,148
Current assets ........... 1,291,003 1,464,437 1,434,040 1,280,464 1,379,203
Current liabilities ......... 684,355 620,464 591,425 624,148 572,278
Long-term debt, net of
current maturities ....... 1,533,990 1,293,179 1,470,567 1,606,993 1,738,936
Stockholders’ equity ....... 1,400,346 1,434,939 1,387,175 1,334,261 1,420,923
Return (loss) on average
equity(1) ............. (1.7)% 4.2% 3.8% (2.0)% 6.9%
Cash dividends declared per
common share ......... $ 0.16 $ 0.16 $ 0.16 $ 0.16 $ 0.16
(1) Calculated by dividing net income (loss) by the average of beginning and ending stockholders’
equity for the year.
(2) On November 12, 2010, we completed the ExpressJet Merger for $136.5 million in cash. Our 2010
consolidated operating results contain 50 days of additional revenue and expenses generated
subsequent to the ExpressJet Merger.
Selected Operating Data
Year Ended December 31,
2014 2013 2012 2011 2010
Block hours .................... 2,275,562 2,380,118 2,297,014 2,250,280 1,547,562
Departures .................... 1,357,454 1,453,601 1,435,512 1,390,523 1,001,766
Passengers carried ............... 58,962,010 60,581,948 58,803,690 55,836,271 40,411,089
Revenue passenger miles (000) ...... 31,499,397 31,834,735 30,088,278 29,109,039 20,227,220
Available seat miles (000) ......... 38,220,150 39,207,910 37,278,554 36,698,859 25,503,845
Revenue per available seat mile ..... 8.5¢ 8.4¢ 9.5¢ 10.0¢ 10.8¢
Cost per available seat mile ........ 8.6¢ 8.2¢ 9.2¢ 10.1¢ 10.4¢
Average passenger trip length ....... 534 525 512 521 501
Number of operating aircraft at end of
year ........................ 747 755 738 732 704
37