SkyWest Airlines 2014 Annual Report Download - page 43
Download and view the complete annual report
Please find page 43 of the 2014 SkyWest Airlines annual report below. You can navigate through the pages in the report by either clicking on the pages listed below, or by using the keyword search tool below to find specific information within the annual report.-
 1
1 -
2
-
3
-
4
-
5
-
6
-
7
-
8
-
9
-
10
-
11
-
12
-
13
-
14
-
15
-
16
-
17
-
18
-
19
-
20
-
21
-
22
-
23
-
24
-
25
-
26
-
27
-
28
-
29
-
30
-
31
-
32
-
 33
33 -
 34
34 -
 35
35 -
 36
36 -
 37
37 -
 38
38 -
 39
39 -
 40
40 -
 41
41 -
 42
42 -
 43
43 -
 44
44 -
 45
45 -
 46
46 -
 47
47 -
 48
48 -
 49
49 -
 50
50 -
 51
51 -
 52
52 -
 53
53 -
54
-
55
-
56
-
57
-
58
-
59
-
60
-
61
-
62
-
63
-
64
-
65
-
66
-
67
-
68
-
69
-
70
-
71
-
72
-
73
-
74
-
75
-
76
-
77
-
78
-
79
-
80
-
81
-
82
-
83
-
84
-
85
-
86
-
87
-
88
-
89
-
90
-
91
-
92
-
93
-
94
-
95
-
96
-
97
-
98
-
99
-
100
-
101
-
102
-
103
-
104
-
105
-
106
-
107
-
108
-
109
-
110
-
111
-
112
-
113
-
114
-
115
-
116
-
117
-
118
-
119
-
120
-
121
-
122
-
123
-
124
-
125
-
126
-
127
-
128
-
129
-
130
-
131
-
132
-
133
-
134
-
135
-
136
-
137
-
138
-
139
-
140
-
141
-
142
-
143
-
144
-
145
-
146
-
147
-
148
-
149
-
150
-
151
-
152
-
153
-
154
-
155
-
156
-
157
-
158
-
159
-
160
-
161
-
162
-
163
-
164
-
165
-
166
-
167
-
168
-
169
-
170
-
171
-
172
-
173
-
174
-
175
-
176
-
177
-
178
 |
 |

The following terms used in this section and elsewhere in this Report have the meanings indicated
below:
‘‘Revenue passenger miles’’ represents the number of miles flown by revenue passengers.
‘‘Available seat miles’’ represents the number of seats available for passengers multiplied by the
number of miles those seats are flown.
‘‘Revenue per available seat mile’’ represents passenger revenue divided by available seat miles.
‘‘Cost per available seat mile’’ represents operating expenses plus interest divided by available seat
miles.
‘‘Number of operating aircraft at end of year’’ excludes aircraft leased to un-affiliated and affiliated
entities.
ITEM 7. MANAGEMENT’S DISCUSSION AND ANALYSIS OF FINANCIAL CONDITION AND
RESULTS OF OPERATIONS
The following discussion and analysis presents factors that had a material effect on our results of
operations during the years ended December 31, 2014, 2013 and 2012. Also discussed is our financial
position as of December 31, 2014 and 2013. You should read this discussion in conjunction with our
consolidated financial statements, including the notes thereto, appearing elsewhere in this Report or
incorporated herein by reference. This discussion and analysis contains forward-looking statements. Please
refer to the sections of this Report entitled ‘‘Cautionary Statement Concerning Forward-looking Statements’’
and ‘‘Item 1A. Risk Factors’’ for discussion of some of the uncertainties, risks and assumptions associated
with these statements.
Overview
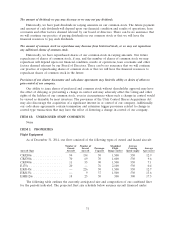
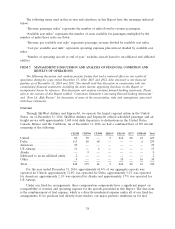
Through SkyWest Airlines and ExpressJet, we operate the largest regional airline in the United
States. As of December 31, 2014, SkyWest Airlines and ExpressJet offered scheduled passenger and air
freight service with approximately 3,600 total daily departures to destinations in the United States,
Canada, Mexico and the Caribbean. As of December 31, 2014, we had a combined fleet of 749 aircraft
consisting of the following:
CRJ200 CRJ700 CRJ900 ERJ135 ERJ145 E175 EMB120 Total
United ..................... 89 70 — 9 216 20 21 425
Delta ...................... 113 60 60 — — — 6 239
American ................... 29 — — — — — — 29
US Airways .................. 11 — 4 — — — — 15
Alaska ...................... — 9 — — — — — 9
Subleased to an un-affiliated entity . 2 — — — — — — 2
Other ...................... 4 — — — 10 — 16 30
Total ....................... 248 139 64 9 226 20 43 749
For the year ended December 31, 2014, approximately 61.4% of our aggregate capacity was
operated for United, approximately 31.6% was operated for Delta, approximately 3.2% was operated
for American, approximately 2.1% was operated for Alaska and approximately 1.7% was operated for
US Airways.
Under our fixed-fee arrangements, three compensation components have a significant impact on
comparability of revenue and operating expense for the periods presented in this Report. The first item
is the reimbursement of fuel expense, which is a directly-reimbursed expense under all of our fixed-fee
arrangements. If we purchase fuel directly from vendors, our major partners reimburse us for fuel
38