SkyWest Airlines 2014 Annual Report Download - page 58
Download and view the complete annual report
Please find page 58 of the 2014 SkyWest Airlines annual report below. You can navigate through the pages in the report by either clicking on the pages listed below, or by using the keyword search tool below to find specific information within the annual report.-
 1
1 -
2
-
3
-
4
-
5
-
6
-
7
-
8
-
9
-
10
-
11
-
12
-
13
-
14
-
15
-
16
-
17
-
18
-
19
-
20
-
21
-
22
-
23
-
24
-
25
-
26
-
27
-
28
-
29
-
30
-
31
-
32
-
33
-
34
-
35
-
36
-
37
-
38
-
39
-
40
-
41
-
42
-
43
-
44
-
45
-
46
-
47
-
 48
48 -
 49
49 -
 50
50 -
 51
51 -
 52
52 -
 53
53 -
 54
54 -
 55
55 -
 56
56 -
 57
57 -
 58
58 -
 59
59 -
 60
60 -
 61
61 -
 62
62 -
 63
63 -
 64
64 -
 65
65 -
 66
66 -
 67
67 -
 68
68 -
69
-
70
-
71
-
72
-
73
-
74
-
75
-
76
-
77
-
78
-
79
-
80
-
81
-
82
-
83
-
84
-
85
-
86
-
87
-
88
-
89
-
90
-
91
-
92
-
93
-
94
-
95
-
96
-
97
-
98
-
99
-
100
-
101
-
102
-
103
-
104
-
105
-
106
-
107
-
108
-
109
-
110
-
111
-
112
-
113
-
114
-
115
-
116
-
117
-
118
-
119
-
120
-
121
-
122
-
123
-
124
-
125
-
126
-
127
-
128
-
129
-
130
-
131
-
132
-
133
-
134
-
135
-
136
-
137
-
138
-
139
-
140
-
141
-
142
-
143
-
144
-
145
-
146
-
147
-
148
-
149
-
150
-
151
-
152
-
153
-
154
-
155
-
156
-
157
-
158
-
159
-
160
-
161
-
162
-
163
-
164
-
165
-
166
-
167
-
168
-
169
-
170
-
171
-
172
-
173
-
174
-
175
-
176
-
177
-
178
 |
 |

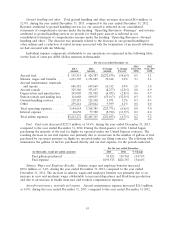
Ground handling and other. Total ground handling and other revenues decreased $8.6 million, or
12.9%, during the year ended December 31, 2013, compared to the year ended December 31, 2012.
Revenue attributed to ground handling services for our aircraft is reflected in our consolidated
statements of comprehensive income under the heading ‘‘Operating Revenues—Passenger’’ and revenue
attributed to ground handling services we provide for third-party aircraft is reflected in our
consolidated statements of comprehensive income under the heading ‘‘Operating Revenues—Ground
handling and other.’’ The decrease was primarily related to the decrease in our ground handling for
other airlines and a reduction of rental revenue associated with the termination of an aircraft sub-lease
we had executed with Air Mekong.
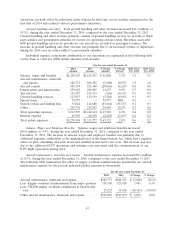
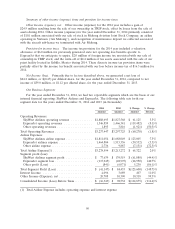
Individual expense components attributable to our operations are expressed in the following table
on the basis of cents per ASM. (dollar amounts in thousands).
For the year ended December 31,
2013 2012
2013 2012 $ Change % Change Cents Per Cents Per
Amount Amount Amount Percent ASM ASM
Aircraft fuel ................ $ 193,513 $ 426,387 $(232,874) (54.6)% 0.5 1.1
Salaries, wages and benefits .... 1,211,307 1,171,689 39,618 3.4% 3.1 3.1
Aircraft maintenance, materials
and repairs ............... 686,381 659,869 26,512 4.0% 1.8 1.8
Aircraft rentals .............. 325,360 333,637 (8,277) (2.5)% 0.8 0.9
Depreciation and amortization . . 245,005 251,958 (6,953) (2.8)% 0.6 0.7
Station rentals and landing fees . . 114,688 169,855 (55,167) (32.5)% 0.3 0.5
Ground handling services ...... 129,119 125,148 3,971 3.2% 0.3 0.3
Other .................... 239,241 229,842 9,399 4.1% 0.6 0.6
Total operating expenses ....... 3,144,614 3,368,385 (223,771) (6.6)% 8.0 9.0
Interest expense ............. 68,658 77,380 (8,722) (11.3)% 0.2 0.2
Total airline expenses ......... $3,213,272 $3,445,765 (232,493) (6.7)% 8.2 9.2
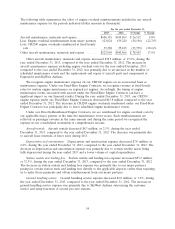
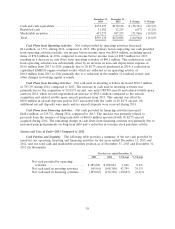
Fuel. Fuel costs decreased $232.9 million, or 54.6%, during the year ended December 31, 2013,
compared to the year ended December 31, 2012. During the third quarter of 2012, United began
purchasing the majority of the fuel for flights we operated under our United Express contracts. The
resulting decrease in our fuel expense was primarily due to an increase in the number of gallons of fuel
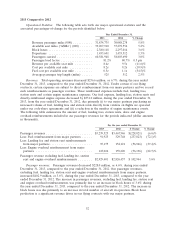
purchased by our major partners on flights we operated under our flying contracts. The following table
summarizes the gallons of fuel we purchased directly and our fuel expense, for the periods indicated:
For the year ended December,
(in thousands, except per gallon amounts) 2013 2012 % Change
Fuel gallons purchased ..................... 53,825 118,765 (54.7)%
Fuel expense ............................. $193,513 $426,387 (54.6)%
Salaries, Wages and Employee Benefits. Salaries, wages and employee benefits increased
$39.6 million, or 3.4%, during the year ended December 31, 2013, compared to the year ended
December 31, 2012. The increase in salaries, wages and employee benefits was primarily due to an
increase in crew and mechanic wages attributable to increased departures and block-hour production
and due to an increase in health insurance and workers compensation expenses.
Aircraft maintenance, materials and repairs. Aircraft maintenance expense increased $26.5 million,
or 4.0%, during the year ended December 31, 2013, compared to the year ended December 31 2012.
53