Sears 2008 Annual Report Download - page 91
Download and view the complete annual report
Please find page 91 of the 2008 Sears annual report below. You can navigate through the pages in the report by either clicking on the pages listed below, or by using the keyword search tool below to find specific information within the annual report.-
 1
1 -
2
-
3
-
4
-
5
-
6
-
7
-
8
-
9
-
10
-
11
-
12
-
13
-
14
-
15
-
16
-
17
-
18
-
19
-
20
-
21
-
22
-
23
-
24
-
25
-
26
-
27
-
28
-
29
-
30
-
31
-
32
-
33
-
34
-
35
-
36
-
37
-
38
-
39
-
40
-
41
-
42
-
43
-
44
-
45
-
46
-
47
-
48
-
49
-
50
-
51
-
52
-
53
-
54
-
55
-
56
-
57
-
58
-
59
-
60
-
61
-
62
-
63
-
64
-
65
-
66
-
67
-
68
-
69
-
70
-
71
-
72
-
73
-
74
-
75
-
76
-
77
-
78
-
79
-
80
-
 81
81 -
 82
82 -
 83
83 -
 84
84 -
 85
85 -
 86
86 -
 87
87 -
 88
88 -
 89
89 -
 90
90 -
 91
91 -
 92
92 -
 93
93 -
 94
94 -
 95
95 -
 96
96 -
 97
97 -
 98
98 -
 99
99 -
 100
100 -
 101
101 -
102
-
103
 |
 |

SEARS HOLDINGS CORPORATION
Notes to Consolidated Financial Statements—(Continued)
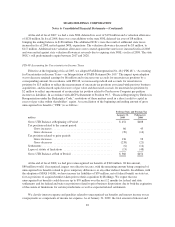
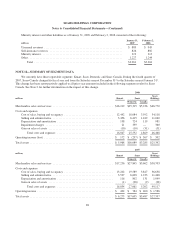
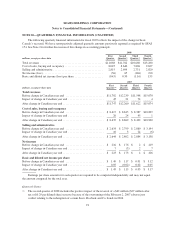
NOTE 20—QUARTERLY FINANCIAL INFORMATION (UNAUDITED)
The following quarterly financial information for fiscal 2007 reflects the impact of the change in Sears
Canada’s year end. We have retrospectively adjusted quarterly amounts previously reported as required by SFAS
154. See Note 2 for further discussion of this change in accounting principle.
2008
millions, except per share data
First
Quarter
Second
Quarter(1)
Third
Quarter(2)
Fourth
Quarter(3)
Total revenues ............................................ $11,068 $11,762 $10,660 $13,280
Cost of sales, buying and occupancy ........................... 8,045 8,640 7,806 9,627
Selling and administrative ................................... 2,815 2,694 2,731 2,820
Net income (loss) .......................................... (56) 65 (146) 190
Basic and diluted net income (loss) per share .................... (0.43) 0.50 (1.16) 1.55
2007
millions, except per share data
First
Quarter(4)
Second
Quarter
Third
Quarter
Fourth
Quarter
Total revenues
Before change in Canadian year end ........................... $11,702 $12,239 $11,548 $15,070
Impact of change in Canadian year end ......................... 45 21 74 4
After change in Canadian year end ............................. $11,747 $12,260 $11,622 $15,074
Cost of sales, buying and occupancy
Before change in Canadian year end ........................... $ 8,417 $ 8,845 $ 8,387 $10,899
Impact of change in Canadian year end ......................... 20 24 45 1
After change in Canadian year end ............................. $ 8,437 $ 8,869 $ 8,432 $10,900
Selling and administrative
Before change in Canadian year end ........................... $ 2,634 $ 2,799 $ 2,860 $ 3,144
Impact of change in Canadian year end ......................... 10 3 24 (6)
After change in Canadian year end ............................. $ 2,644 $ 2,802 $ 2,884 $ 3,138
Net income
Before change in Canadian year end ........................... $ 216 $ 176 $ 2 $ 419
Impact of change in Canadian year end ......................... 7 (3) 2 7
After change in Canadian year end ............................. $ 223 $ 173 $ 4 $ 426
Basic and diluted net income per share
Before change in Canadian year end ........................... $ 1.40 $ 1.17 $ 0.01 $ 3.12
Impact of change in Canadian year end ......................... 0.05 (0.02) 0.02 0.05
After change in Canadian year end ............................. $ 1.45 $ 1.15 $ 0.03 $ 3.17
Earnings per share amounts for each quarter are required to be computed independently and may not equal
the amount computed for the total year.
Quarterly Items:
(1) The second quarter of 2008 includes the positive impact of the reversal of a $62 million ($37 million after
tax or $0.29 per diluted share) reserve because of the overturning of the February 2, 2007 adverse jury
verdict relating to the redemption of certain Sears, Roebuck and Co. bonds in 2004.
91