Sears 2008 Annual Report Download - page 35
Download and view the complete annual report
Please find page 35 of the 2008 Sears annual report below. You can navigate through the pages in the report by either clicking on the pages listed below, or by using the keyword search tool below to find specific information within the annual report.-
 1
1 -
2
-
3
-
4
-
5
-
6
-
7
-
8
-
9
-
10
-
11
-
12
-
13
-
14
-
15
-
16
-
17
-
18
-
19
-
20
-
21
-
22
-
23
-
24
-
 25
25 -
 26
26 -
 27
27 -
 28
28 -
 29
29 -
 30
30 -
 31
31 -
 32
32 -
 33
33 -
 34
34 -
 35
35 -
 36
36 -
 37
37 -
 38
38 -
 39
39 -
 40
40 -
 41
41 -
 42
42 -
 43
43 -
 44
44 -
 45
45 -
46
-
47
-
48
-
49
-
50
-
51
-
52
-
53
-
54
-
55
-
56
-
57
-
58
-
59
-
60
-
61
-
62
-
63
-
64
-
65
-
66
-
67
-
68
-
69
-
70
-
71
-
72
-
73
-
74
-
75
-
76
-
77
-
78
-
79
-
80
-
81
-
82
-
83
-
84
-
85
-
86
-
87
-
88
-
89
-
90
-
91
-
92
-
93
-
94
-
95
-
96
-
97
-
98
-
99
-
100
-
101
-
102
-
103
 |
 |

Depreciation and Amortization
Depreciation and amortization expense was $802 million and $927 million for fiscal 2007 and fiscal 2006,
respectively. The decrease in fiscal 2007 is primarily attributable to additional property and equipment becoming
fully depreciated during the year, thereby decreasing our depreciable asset base.
Operating Income
For fiscal 2007, Sears Domestic’s operating income decreased $539 million to $784 million, as compared to
$1.3 billion in fiscal 2006. The decrease primarily reflects lower total gross margin dollars generated as a result
of lower overall sales levels and a decline in gross margin rate as a result of markdowns taken to clear excess
levels of inventory. The impact of these items was offset by $125 million decline in depreciation and
amortization expense.
Sears Canada
Sears Canada, a consolidated, 73%-owned subsidiary of Sears, conducts similar retail operations as Sears
Domestic. During the fourth quarter of fiscal 2007, Sears Canada changed its fiscal year end from the Saturday
nearest December 31st to the Saturday nearest January 31st. This change has been retrospectively applied to prior
year amounts as required by SFAS No. 154, “Accounting Changes and Error Corrections—A Replacement of
APB Opinion No. 20 and SFAS No. 3.” See Note 2 to the Consolidated Financial Statements for further
explanation of this change.
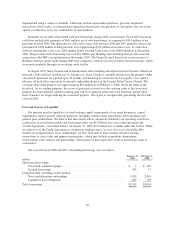
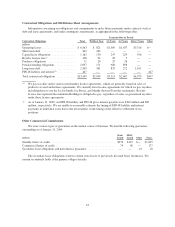
Sears Canada results and key statistics were as follows:
millions, except for number of stores 2008 2007 2006
Merchandise sales and services ........................................... $5,236 $5,602 $5,190
Cost of sales, buying and occupancy ....................................... 3,592 3,847 3,643
Gross margin dollars ................................................... 1,644 1,755 1,547
Gross margin rate ..................................................... 31.4% 31.3% 29.8%
Selling and administrative ............................................... 1,189 1,233 1,131
Selling and administrative expense as a percentage of total revenues ............. 22.7% 22.0% 21.8%
Depreciation and amortization ............................................ 119 131 139
Gain on sales of assets .................................................. (31) (9) —
Restructuring charges ................................................... — — 19
Total costs and expenses ............................................ 4,869 5,202 4,932
Operating income ...................................................... $ 367 $ 400 $ 258
Number of:
Full-line Stores .................................................... 122 121 123
Specialty Stores ................................................... 266 259 250
Total Sears Canada Stores ............................................... 388 380 373
Fiscal 2008 Compared to Fiscal 2007
Total Revenues
Sears Canada’s total revenues decreased by $366 million, or 6.5%, to $5.2 billion for fiscal 2008 as
compared to the same period last year. The decrease in total revenues includes a $96 million decline due to the
impact of unfavorable exchange rates during the year. On an equivalent Canadian dollar basis, revenues
decreased by $270 million, primarily reflecting an decrease in Sears Canada’s sales at their Full-line, Home,
Outlet, and Direct formats as compared to fiscal 2007. These declines were partially offset by an increase in
revenues from services and credit programs.
35