Sears 2008 Annual Report Download - page 19
Download and view the complete annual report
Please find page 19 of the 2008 Sears annual report below. You can navigate through the pages in the report by either clicking on the pages listed below, or by using the keyword search tool below to find specific information within the annual report.-
 1
1 -
2
-
3
-
4
-
5
-
6
-
7
-
8
-
 9
9 -
 10
10 -
 11
11 -
 12
12 -
 13
13 -
 14
14 -
 15
15 -
 16
16 -
 17
17 -
 18
18 -
 19
19 -
 20
20 -
 21
21 -
 22
22 -
 23
23 -
 24
24 -
 25
25 -
 26
26 -
 27
27 -
 28
28 -
 29
29 -
30
-
31
-
32
-
33
-
34
-
35
-
36
-
37
-
38
-
39
-
40
-
41
-
42
-
43
-
44
-
45
-
46
-
47
-
48
-
49
-
50
-
51
-
52
-
53
-
54
-
55
-
56
-
57
-
58
-
59
-
60
-
61
-
62
-
63
-
64
-
65
-
66
-
67
-
68
-
69
-
70
-
71
-
72
-
73
-
74
-
75
-
76
-
77
-
78
-
79
-
80
-
81
-
82
-
83
-
84
-
85
-
86
-
87
-
88
-
89
-
90
-
91
-
92
-
93
-
94
-
95
-
96
-
97
-
98
-
99
-
100
-
101
-
102
-
103
 |
 |

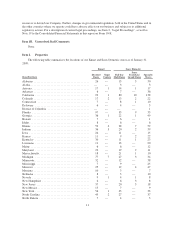
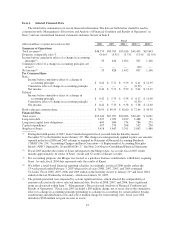
Item 6. Selected Financial Data
The table below summarizes our recent financial information. The data set forth below should be read in
conjunction with “Management’s Discussion and Analysis of Financial Condition and Results of Operations” in
Item 7 and our consolidated financial statements and notes thereto in Item 8.
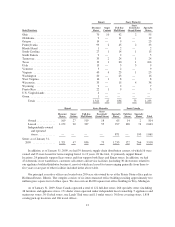
Fiscal
dollars in millions, except per share and store data 2008 2007 2006(1) 2005(1)(2) 2004(3)
Summary of Operations
Total revenues(4) ................................... $46,770 $50,703 $53,016 $49,455 $19,843
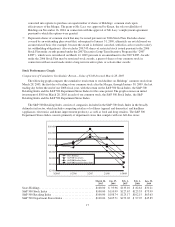
Domestic comparable sales % ........................ (8.0)% (4.3)% (3.7)% (5.3)% (11.0)%
Income before cumulative effect of a change in accounting
principle(5) ...................................... 53 826 1,492 947 1,106
Cumulative effect of a change in accounting principle, net
of tax(5) ........................................ — — — (90) —
Net income(5) ..................................... 53 826 1,492 857 1,106
Per Common Share
Basic:
Income before cumulative effect of a change in
accounting principle .......................... $ 0.42 $ 5.71 $ 9.59 $ 6.21 $ 12.39
Cumulative effect of change in accounting principle . . — — — (0.59) —
Net income ................................... $ 0.42 $ 5.71 $ 9.59 $ 5.62 $ 12.39
Diluted:
Income before cumulative effect of a change in
accounting principle .......................... $ 0.42 $ 5.70 $ 9.58 $ 6.17 $ 11.00
Cumulative effect of change in accounting principle . . — — — (0.59) —
Net income ................................... $ 0.42 $ 5.70 $ 9.58 $ 5.58 $ 11.00
Book value per common share ........................ $ 76.91 $ 80.59 $ 82.60 $ 72.64 $ 50.39
Financial Data
Total assets ....................................... $25,342 $27,397 $29,906 $30,467 $ 8,651
Long-term debt .................................... 1,527 1,922 2,109 2,488 91
Long-term capital lease obligations .................... 605 684 734 786 275
Capital expenditures ................................ 497 570 508 552 230
Number of Stores .................................. 3,918 3,847 3,791 3,843 1,480
(1) During the fourth quarter of 2007, Sears Canada changed its fiscal year end from the Saturday nearest
December 31st to the Saturday nearest January 31st. This change was retrospectively applied to prior year amounts
reported in the fiscal 2006 and 2005 columns as required by Statement of Financial Accounting Standards
(“SFAS”) No. 154, “Accounting Changes and Error Corrections—A Replacement of Accounting Principles
Board (“APB”) Opinion No. 20 and SFAS No. 3.” See Note 2 of Notes to Consolidated Financial Statements.
(2) Fiscal 2005 includes the results of Sears subsequent to the Merger date. As a result, fiscal 2005 results
include approximately 44 weeks of Sears’ results and 52 weeks of Kmart’s results.
(3) For accounting purposes, the Merger was treated as a purchase business combination, with Kmart acquiring
Sears. As such, fiscal 2004 data represents only the results of Kmart.
(4) We follow a retail-based financial reporting calendar. Accordingly, our fiscal 2006 results reflect the
53-week period ended February 3, 2007 whereas fiscal years 2008, 2007, 2005, and 2004 contained
52-weeks. Fiscal 2008, 2007, 2006 and 2005 ended on the Saturday closest to January 31st and fiscal 2004
ended on the last Wednesday in January, which was January 30, 2005.
(5) The periods presented were impacted by certain significant items, which affected the comparability of
amounts reflected in the above selected financial data. For fiscal 2008, 2007, and 2006, these significant
items are discussed within Item 7, “Management’s Discussion and Analysis of Financial Condition and
Results of Operations.” Fiscal year 2005 included a $90 million charge, net of taxes, due to the cumulative
effect of a change in accounting principle pertaining to a change in accounting for certain indirect buying,
warehousing and distribution costs and a $111 million charge for restructuring costs; fiscal year 2004
included a $946 million net gain on sales of assets.
19