Sears 2008 Annual Report Download - page 17
Download and view the complete annual report
Please find page 17 of the 2008 Sears annual report below. You can navigate through the pages in the report by either clicking on the pages listed below, or by using the keyword search tool below to find specific information within the annual report.-
 1
1 -
2
-
3
-
4
-
5
-
6
-
 7
7 -
 8
8 -
 9
9 -
 10
10 -
 11
11 -
 12
12 -
 13
13 -
 14
14 -
 15
15 -
 16
16 -
 17
17 -
 18
18 -
 19
19 -
 20
20 -
 21
21 -
 22
22 -
 23
23 -
 24
24 -
 25
25 -
 26
26 -
 27
27 -
28
-
29
-
30
-
31
-
32
-
33
-
34
-
35
-
36
-
37
-
38
-
39
-
40
-
41
-
42
-
43
-
44
-
45
-
46
-
47
-
48
-
49
-
50
-
51
-
52
-
53
-
54
-
55
-
56
-
57
-
58
-
59
-
60
-
61
-
62
-
63
-
64
-
65
-
66
-
67
-
68
-
69
-
70
-
71
-
72
-
73
-
74
-
75
-
76
-
77
-
78
-
79
-
80
-
81
-
82
-
83
-
84
-
85
-
86
-
87
-
88
-
89
-
90
-
91
-
92
-
93
-
94
-
95
-
96
-
97
-
98
-
99
-
100
-
101
-
102
-
103
 |
 |
converted into options to purchase an equal number of shares of Holdings’ common stock upon
effectiveness of the Merger. The grant to Mr. Lacy was approved by Kmart, the sole stockholder of
Holdings on November 16, 2004, in connection with the approval of Mr. Lacy’s employment agreement
pursuant to which the options were granted.
(2) Represents shares of common stock that may be issued pursuant our 2006 Stock Plan. Excludes shares
covered by an outstanding plan award that, subsequent to January 31, 2009, ultimately are not delivered on
an unrestricted basis (for example, because the award is forfeited, canceled, settled in cash or used to satisfy
tax withholding obligations). Also excludes 280,743 shares of restricted stock issued pursuant to the 2006
Stock Plan under awards granted under the 2007 Executive Long-Term Incentive Program (the “2007
LTIP”), which were surrendered on March 12, 2009 pursuant to an amendment to the 2007 LTIP. Awards
under the 2006 Stock Plan may be restricted stock awards, a grant of shares of our common stock in
connection with an award made under a long-term incentive plan, or certain other awards.
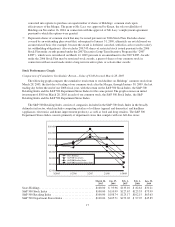
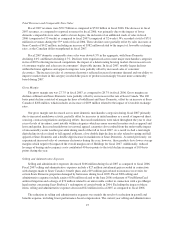
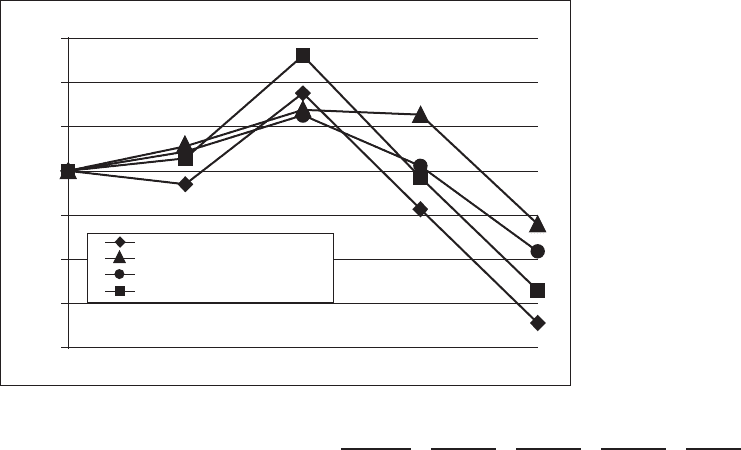
Stock Performance Graph
Comparison of Cumulative Stockholder Return—Value of $100 Invested March 28, 2005
The following graph compares the cumulative total return to stockholders on Holdings’ common stock from
March 28, 2005, the first day of trading of our common stock after the Merger, through January 30, 2009, the last
trading day before the end of our 2008 fiscal year, with the return on the S&P 500 Stock Index, the S&P 500
Retailing Index and the S&P 500 Department Stores Index for the same period. The graph assumes an initial
investment of $100 on March 28, 2005 in each of our common stock, the S&P 500 Stock Index, the S&P
Retailing Index and the S&P 500 Department Stores Index.
The S&P 500 Retailing Index consists of companies included in the S&P 500 Stock Index in the broadly
defined retail sector, which includes competing retailers of softlines (apparel and domestics) and hardlines
(appliances, electronics and home improvement products), as well as food and drug retailers. The S&P 500
Department Stores Index consists primarily of department stores that compete with our full-line stores.
$160.00
3/28/05 1/27/06 2/2/07 2/1/08 1/30/09
$140.00
$120.00
$100.00
$80.00
$60.00
$40.00
$20.00
Sears Holdings
S&P 500 Stock Index
S&P 500 Retailing Index
S&P 500 Department Stores Index
March 28,
2005
Jan. 27,
2006
Feb. 2,
2007
Feb. 1,
2008
Jan. 30,
2009
Sears Holdings ..................................... $100.00 $ 93.96 $135.10 $ 82.61 $31.21
S&P 500 Stock Index ............................... $100.00 $110.99 $127.67 $125.33 $75.99
S&P 500 Retailing Index ............................ $100.00 $108.74 $125.17 $102.15 $63.63
S&P 500 Department Stores Index ..................... $100.00 $105.71 $152.02 $ 97.07 $45.85
17