Sears 2008 Annual Report Download - page 29
Download and view the complete annual report
Please find page 29 of the 2008 Sears annual report below. You can navigate through the pages in the report by either clicking on the pages listed below, or by using the keyword search tool below to find specific information within the annual report.-
 1
1 -
2
-
3
-
4
-
5
-
6
-
7
-
8
-
9
-
10
-
11
-
12
-
13
-
14
-
15
-
16
-
17
-
18
-
 19
19 -
 20
20 -
 21
21 -
 22
22 -
 23
23 -
 24
24 -
 25
25 -
 26
26 -
 27
27 -
 28
28 -
 29
29 -
 30
30 -
 31
31 -
 32
32 -
 33
33 -
 34
34 -
 35
35 -
 36
36 -
 37
37 -
 38
38 -
 39
39 -
40
-
41
-
42
-
43
-
44
-
45
-
46
-
47
-
48
-
49
-
50
-
51
-
52
-
53
-
54
-
55
-
56
-
57
-
58
-
59
-
60
-
61
-
62
-
63
-
64
-
65
-
66
-
67
-
68
-
69
-
70
-
71
-
72
-
73
-
74
-
75
-
76
-
77
-
78
-
79
-
80
-
81
-
82
-
83
-
84
-
85
-
86
-
87
-
88
-
89
-
90
-
91
-
92
-
93
-
94
-
95
-
96
-
97
-
98
-
99
-
100
-
101
-
102
-
103
 |
 |

Business Segment Results
Kmart
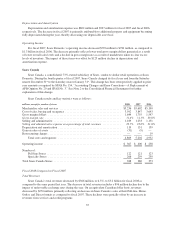
Kmart results and key statistics were as follows:
millions, except for number of stores 2008 2007 2006
Merchandise sales and services ........................................ $16,219 $17,256 $18,647
Cost of sales, buying and occupancy .................................... 12,442 13,202 14,061
Gross margin dollars ................................................ 3,777 4,054 4,586
Gross margin rate .................................................. 23.3% 23.5% 24.6%
Selling and administrative ............................................ 3,456 3,537 3,623
Selling and administrative expense as a percentage of total revenues .......... 21.3% 20.5% 19.4%
Depreciation and amortization ......................................... 138 116 77
Impairment charges ................................................. 21 — —
Gain on sales of assets ............................................... (10) (1) (71)
Restructuring charges ................................................ — — 9
Total costs and expenses ......................................... 16,047 16,854 17,699
Operating income ................................................... $ 172 $ 402 $ 948
Total Kmart Stores .................................................. 1,368 1,382 1,388
Fiscal 2008 Compared to Fiscal 2007
Total Revenues and Comparable Store Sales
Comparable store sales and total sales decreased 6.1% and 6.0%, respectively, during fiscal 2008. The 6.1%
decline in Kmart comparable store sales during fiscal 2008 compares to a 4.7% decline in comparable store sales
recorded for fiscal 2007. Comparable store sales declines were driven by mid to high single digit declines
recorded within the apparel and home categories. We believe the overall decline in comparable store sales
reflects the negative impact of certain external economic factors, as noted above in the discussion of Holdings’
consolidated results.
Gross Margin
Kmart generated $3.8 billion in total gross margin in fiscal 2008, as compared to $4.1 billion in fiscal 2007.
The $277 million decline includes a charge of $15 million recorded to markdown inventory in connection with
store closings announced during the third and fourth quarters of 2008 and primarily reflects the negative gross
margin impact of lower overall sales, as well as a decline in Kmart’s gross margin rate. Kmart’s gross margin
rate was 23.3%, as compared to 23.5% in fiscal 2007, a decrease of 0.2%. The decrease in Kmart’s gross margin
rate is due to an increase of 0.5% in buying and occupancy costs (which are more fixed in nature) as a percentage
of sales, offset by an increase in margin related to lower royalties paid on select merchandise.
Selling and Administrative Expenses
Fiscal 2008 selling and administrative expenses decreased $81 million as compared to fiscal 2007. The
decline in selling and administrative expenses mainly reflects a $68 million reduction in payroll expenses as well
as a $14 million reduction in advertising costs. These reductions were partially offset by expenses incurred for
certain store closing and severance costs of $12 million. Our selling and administrative expense rate was 21.3%
for fiscal 2008, as compared to 20.5% for fiscal 2007, and increased primarily as a result of lower expense
leverage given lower overall sales.
29