Sears 2008 Annual Report Download - page 51
Download and view the complete annual report
Please find page 51 of the 2008 Sears annual report below. You can navigate through the pages in the report by either clicking on the pages listed below, or by using the keyword search tool below to find specific information within the annual report.-
 1
1 -
2
-
3
-
4
-
5
-
6
-
7
-
8
-
9
-
10
-
11
-
12
-
13
-
14
-
15
-
16
-
17
-
18
-
19
-
20
-
21
-
22
-
23
-
24
-
25
-
26
-
27
-
28
-
29
-
30
-
31
-
32
-
33
-
34
-
35
-
36
-
37
-
38
-
39
-
40
-
 41
41 -
 42
42 -
 43
43 -
 44
44 -
 45
45 -
 46
46 -
 47
47 -
 48
48 -
 49
49 -
 50
50 -
 51
51 -
 52
52 -
 53
53 -
 54
54 -
 55
55 -
 56
56 -
 57
57 -
 58
58 -
 59
59 -
 60
60 -
 61
61 -
62
-
63
-
64
-
65
-
66
-
67
-
68
-
69
-
70
-
71
-
72
-
73
-
74
-
75
-
76
-
77
-
78
-
79
-
80
-
81
-
82
-
83
-
84
-
85
-
86
-
87
-
88
-
89
-
90
-
91
-
92
-
93
-
94
-
95
-
96
-
97
-
98
-
99
-
100
-
101
-
102
-
103
 |
 |

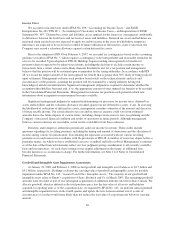
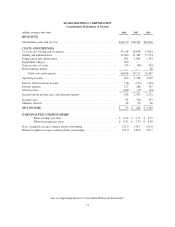
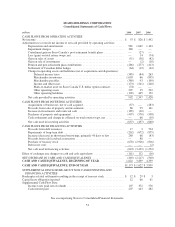
SEARS HOLDINGS CORPORATION
Consolidated Statements of Income
millions, except per share data 2008 2007 2006
REVENUES
Merchandise sales and services ........................................ $46,770 $50,703 $53,016
COSTS AND EXPENSES
Cost of sales, buying and occupancy .................................... 34,118 36,638 37,824
Selling and administrative ............................................ 11,060 11,468 11,574
Depreciation and amortization ......................................... 981 1,049 1,143
Impairment charges ................................................. 360 — —
Gain on sales of assets ............................................... (51) (38) (82)
Restructuring charges ................................................ — — 28
Total costs and expenses ......................................... 46,468 49,117 50,487
Operating income ................................................... 302 1,586 2,529
Interest and investment income ........................................ (46) (135) (253)
Interest expense .................................................... 272 286 335
Other income ...................................................... (108) (17) (24)
Income before income taxes and minority interest ......................... 184 1,452 2,471
Income taxes ....................................................... 85 550 933
Minority interest .................................................... 46 76 46
NET INCOME .................................................... $ 53 $ 826 $ 1,492
EARNINGS PER COMMON SHARE
Basic earnings per share ...................................... $ 0.42 $ 5.71 $ 9.59
Diluted earnings per share .................................... $ 0.42 $ 5.70 $ 9.58
Basic weighted average common shares outstanding ....................... 127.0 144.7 155.6
Diluted weighted average common shares outstanding ...................... 127.0 144.8 155.7
See accompanying Notes to Consolidated Financial Statements.
51