Sears 2008 Annual Report Download - page 22
Download and view the complete annual report
Please find page 22 of the 2008 Sears annual report below. You can navigate through the pages in the report by either clicking on the pages listed below, or by using the keyword search tool below to find specific information within the annual report.-
 1
1 -
2
-
3
-
4
-
5
-
6
-
7
-
8
-
9
-
10
-
11
-
 12
12 -
 13
13 -
 14
14 -
 15
15 -
 16
16 -
 17
17 -
 18
18 -
 19
19 -
 20
20 -
 21
21 -
 22
22 -
 23
23 -
 24
24 -
 25
25 -
 26
26 -
 27
27 -
 28
28 -
 29
29 -
 30
30 -
 31
31 -
 32
32 -
33
-
34
-
35
-
36
-
37
-
38
-
39
-
40
-
41
-
42
-
43
-
44
-
45
-
46
-
47
-
48
-
49
-
50
-
51
-
52
-
53
-
54
-
55
-
56
-
57
-
58
-
59
-
60
-
61
-
62
-
63
-
64
-
65
-
66
-
67
-
68
-
69
-
70
-
71
-
72
-
73
-
74
-
75
-
76
-
77
-
78
-
79
-
80
-
81
-
82
-
83
-
84
-
85
-
86
-
87
-
88
-
89
-
90
-
91
-
92
-
93
-
94
-
95
-
96
-
97
-
98
-
99
-
100
-
101
-
102
-
103
 |
 |

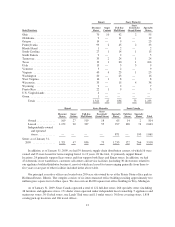
Holdings’ Consolidated Results
Holdings’ consolidated results of operations for fiscal 2008, 2007, and 2006 are summarized as follows:
millions, except per share data 2008 2007(1) 2006(1)
REVENUES
Merchandise sales and services ........................................ $46,770 $50,703 $53,016
COSTS AND EXPENSES
Cost of sales, buying and occupancy .................................... 34,118 36,638 37,824
Gross margin dollars ................................................ 12,652 14,065 15,192
Gross margin rate .................................................. 27.1% 27.7% 28.7%
Selling and administrative ............................................ 11,060 11,468 11,574
Selling and administrative expense as a percentage of total revenues .......... 23.6% 22.6% 21.8%
Depreciation and amortization ......................................... 981 1,049 1,143
Impairment charges ................................................. 360 — —
Gain on sales of assets ............................................... (51) (38) (82)
Restructuring charges ................................................ — — 28
Total costs and expenses ......................................... 46,468 49,117 50,487
Operating income ................................................... 302 1,586 2,529
Interest and investment income ........................................ (46) (135) (253)
Interest expense .................................................... 272 286 335
Other income ...................................................... (108) (17) (24)
Income before income taxes and minority interest ......................... 184 1,452 2,471
Income taxes ....................................................... 85 550 933
Minority interest .................................................... 46 76 46
NET INCOME .................................................... $ 53 $ 826 $ 1,492
EARNINGS PER COMMON SHARE
Diluted earnings per share ............................................ $ 0.42 $ 5.70 $ 9.58
Diluted weighted average common shares outstanding ...................... 127.0 144.8 155.7
(1) During the fourth quarter of 2007, Sears Canada changed its fiscal year end from the Saturday nearest
December 31st to the Saturday nearest January 31st. This change has been retrospectively applied to prior
year amounts reported in the fiscal 2006 column as required by SFAS No. 154. See Note 2 of Notes to
Consolidated Financial Statements.
References to comparable store sales amounts within the following discussion include sales for all stores
operating for a period of at least 12 full months, including remodeled and expanded stores, but excluding store
relocations and stores that have undergone format changes. Comparable store sales results for fiscal 2008 were
calculated based on the 52-week period ended January 31, 2009 as compared to the comparable 52-week period
in the prior year.
Fiscal 2008 Compared to Fiscal 2007
Net Income
For the fiscal year ended January 31, 2009, net income was $53 million, or $0.42 per diluted share
compared with net income of $826 million, or $5.70 per diluted share, for the fiscal year ended February 2, 2008.
Fiscal 2008 results include charges of $437 million ($248 million after tax and minority interest or $1.94 per
22