Sears 2008 Annual Report Download - page 27
Download and view the complete annual report
Please find page 27 of the 2008 Sears annual report below. You can navigate through the pages in the report by either clicking on the pages listed below, or by using the keyword search tool below to find specific information within the annual report.-
 1
1 -
2
-
3
-
4
-
5
-
6
-
7
-
8
-
9
-
10
-
11
-
12
-
13
-
14
-
15
-
16
-
 17
17 -
 18
18 -
 19
19 -
 20
20 -
 21
21 -
 22
22 -
 23
23 -
 24
24 -
 25
25 -
 26
26 -
 27
27 -
 28
28 -
 29
29 -
 30
30 -
 31
31 -
 32
32 -
 33
33 -
 34
34 -
 35
35 -
 36
36 -
 37
37 -
38
-
39
-
40
-
41
-
42
-
43
-
44
-
45
-
46
-
47
-
48
-
49
-
50
-
51
-
52
-
53
-
54
-
55
-
56
-
57
-
58
-
59
-
60
-
61
-
62
-
63
-
64
-
65
-
66
-
67
-
68
-
69
-
70
-
71
-
72
-
73
-
74
-
75
-
76
-
77
-
78
-
79
-
80
-
81
-
82
-
83
-
84
-
85
-
86
-
87
-
88
-
89
-
90
-
91
-
92
-
93
-
94
-
95
-
96
-
97
-
98
-
99
-
100
-
101
-
102
-
103
 |
 |
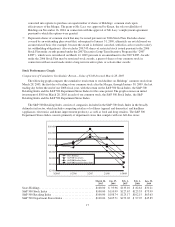
Total Revenues and Comparable Store Sales
Fiscal 2007 revenues were $50.7 billion as compared to $53.0 billion in fiscal 2006. The decrease in fiscal
2007 revenues, as compared to reported revenues for fiscal 2006, was primarily due to the impact of lower
domestic comparable store sales, and to a lesser degree, the inclusion of an additional week of sales in fiscal
2006 (comprised of 53 weeks) as compared to fiscal 2007 (comprised of 52 weeks). We recorded a total of $711
million in revenues during the 53rd week of fiscal 2006. These declines were partially offset by sales increases at
Sears Canada of $412 million, including an increase of $382 million related to the impact of favorable exchange
rates, as the Canadian dollar strengthened in fiscal 2007.
Fiscal 2007 domestic comparable store sales were down 4.3% in the aggregate, with Sears Domestic
declining 4.0% and Kmart declining 4.7%. Declines were experienced across most major merchandise categories
in fiscal 2007 reflecting increased competition, the impact of a deteriorating housing market, the increased costs
of consumer staples and a decrease in consumers’ disposable income. In fiscal 2007, notably larger declines
within the home appliance and apparel categories were partially offset by increased sales of consumer
electronics. The increase in sales of consumer electronics reflected increased consumer demand and our ability to
improve market share in this category in which the prices of products increasingly became more commodity
based during 2007.
Gross Margin
The gross margin rate was 27.7% in fiscal 2007, as compared to 28.7% in fiscal 2006. Gross margin rate
declines at Kmart and Sears Domestic were partially offset by an increase in the rate at Sears Canada. The 100
basis point decline consisted of margin declines at both Kmart and Sears Domestic, offset by an increase at Sears
Canada of $208 million, which includes an increase of $109 million related to the impact of favorable exchange
rates.
Our gross margin rate decreased across most domestic merchandise categories during fiscal 2007 primarily
due to increased markdown activity, partially offset by increases in initial markons as a result of improved direct
sourcing, contract negotiations and pricing efforts. Increased markdowns were taken throughout the year to clear
excess levels of inventory, most notably within categories which are more seasonal in nature such as apparel and
lawn and garden. Increased markdowns in seasonal apparel categories also resulted from the unfavorable impact
of unseasonably warm weather prevalent during much of the fall in fiscal 2007. As a result we had a mid single
digit decline in sales related to fall apparel at Kmart, a low double digit decline in sales related to spring and fall
apparel at Sears Domestic and a double digit increase in markdowns at Sears Domestic. As noted previously, we
experienced increased sales of consumer electronics during the year; however, these products have lower average
margins which negatively impacted the overall margin rate of Holdings for fiscal 2007. Additionally, reduced
leverage of buying and occupancy costs contributed 40 basis points to the total decline in margin of 100 basis
points during the year.
Selling and Administrative Expenses
Selling and administrative expenses decreased $106 million during fiscal 2007 as compared to fiscal 2006.
Fiscal 2007 selling and administrative expenses include a $27 million curtailment gain recorded in connection
with changes made to Sears Canada’s benefit plans and a $19 million gain related to insurance recoveries for
certain Sears Domestic properties damaged by hurricanes during fiscal 2005. Fiscal 2006 selling and
administrative expenses include a gain of $36 million related to the June 2006 settlement of Visa/MasterCard
antitrust litigation and a charge of $74 million related to an unfavorable verdict in connection with a pre-Merger
legal matter concerning Sears Roebuck’s redemption of certain bonds in 2004. Excluding the impact of these
items, selling and administrative expenses decreased $22 million in fiscal 2007 as compared to fiscal 2006.
The reduction in selling and administrative expenses was mainly the result of a reduction in payroll and
benefits expense, including lower performance-based compensation. The current year selling and administrative
27